Updated March 24, 2023
What are Power BI Visuals?
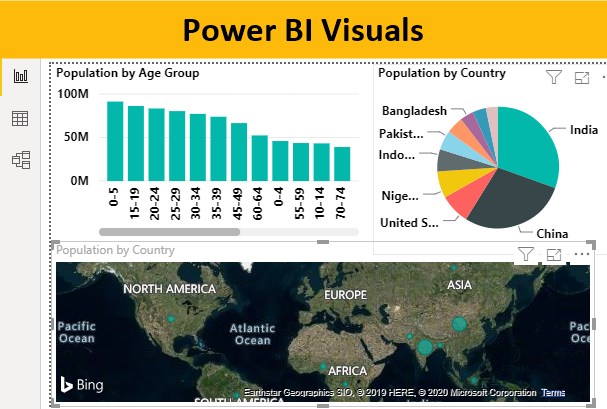
Power BI visuals are the type of charts, graphs, tables, cards, etc available with Power BI to visualize our data. The charts available in Power BI are almost the same as those of MS Office. There we have Bar Chart, Column Chart, Cluster Bar/Column Chart, Stacked Bar/Column Chart, Line Trend, Scattered Chart, Pie and Doughnut Chart, Map/Filled Map, Slicers, etc. All these mentioned chart types are used in various ways with a specific unique individual application.
How to Use Power BI Visuals?
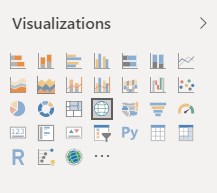
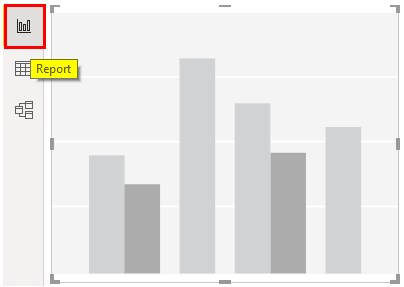
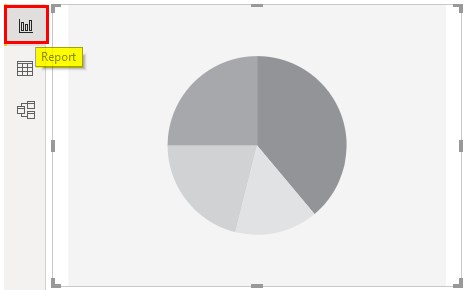
We can able to find Power BI Visuals in Report on the right-hand side of the window as shown below.
Here we have a sample population data which is already been scrubbed in a standard format.
Now we will use the uploaded data and play around with visuals there in Power BI. You can download the excel data from below to use the same for building visuals. It is better if you can download and practice along with us as we show them.
Example #1
Let’s create a simple chart first using the data which we have below. As the data is huge so this will help us in giving beautiful charts and visuals.
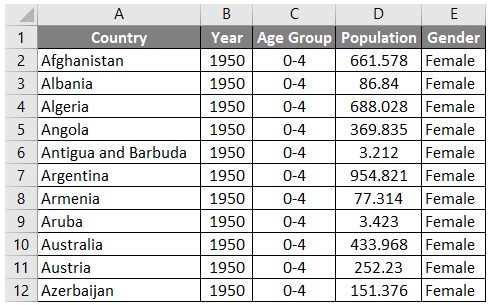
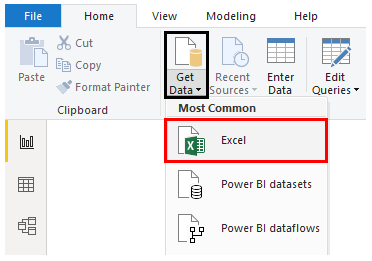
- To upload this data in Power BI, click on Get Data option from the Home menu. Now choose the type of source we want to connect. Here we scrubbed the population data in excel file. So we will browse that file and open it.
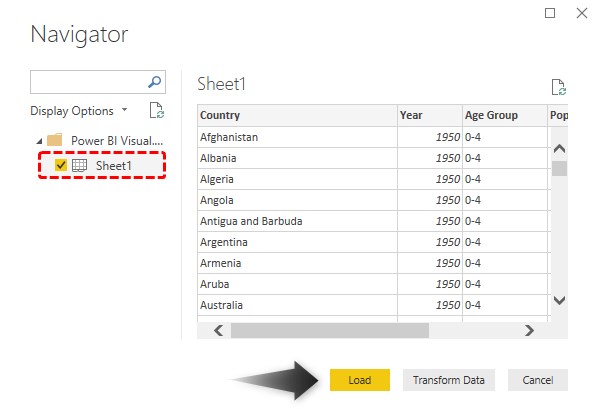
- Select the sheet, which needs to be connected. Here that sheet is Sheet1.
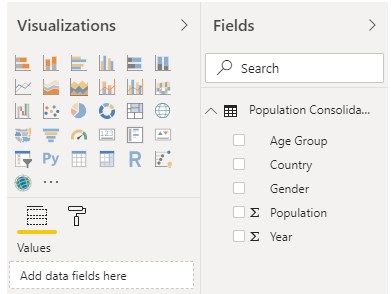
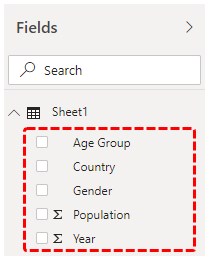
- As we can see under the Fields section name of the imported chart is Population-Consolidated Data. And that has Age group, Country, Gender, Population and Year.
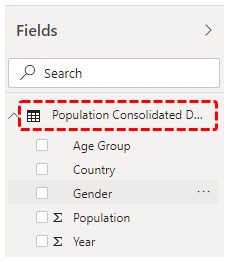
- We will rename the data table from Field section just to standardize it. For this double click on that name or right-click on and select Rename. The new name will be Population Consolidated Data.
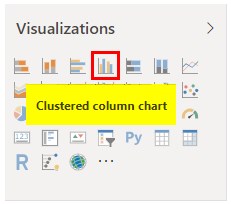
- First we will be plotting Clustered Column Chart which is highlighted as shown below.
- Once we do that, we will get a blank Clustered Column chart as shown below in the report tab.
- Now select the data in which we want to map in the already selected chart. Suppose if we want to see the Age group-wise population so same we need to select from the Fields section as shown below.
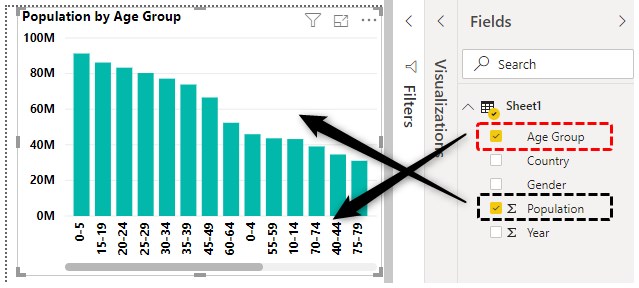
As we can see, the Age Group can be seen in the Axis field whereas Population count is shown on the value field. The same data can be mapped using Clustered Row Chart as well. The difference between Clustered Column and Row is the data mapped will be in vertical tower whereas, in Clustered Row, it will in horizontal.
To make our created chart more attractive, we can add and remove certain things.
- There are 3 more options available below Visualizations which are Fields, Format and Analytics as shown below.
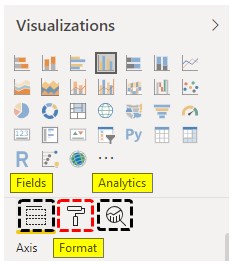
- From Fields, we can remove the already added fields and add the new fields as well. This is the section where we can change the mathematical unit which we want to see.
- From Format, we can format the color, axis, data labels, title in many ways.
- And from Analytics, we can plot Min, Max, Average, Percentile and Medium lines on the graph.
Example #2
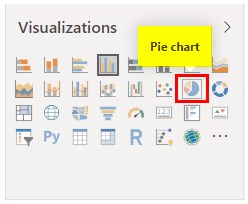
- Let’s see another type of chart from Visualizations section. In this example we will see how to create and set Pie Chart. For this, we will select the Pie Chart option from the Visualization section as shown below.
- Once we do that, we will get a blank Pie Chart in Report tab.
- Now we will be selecting the data fields which we want to map this Pie Chart. Here we will be mapping the Country-wise population.
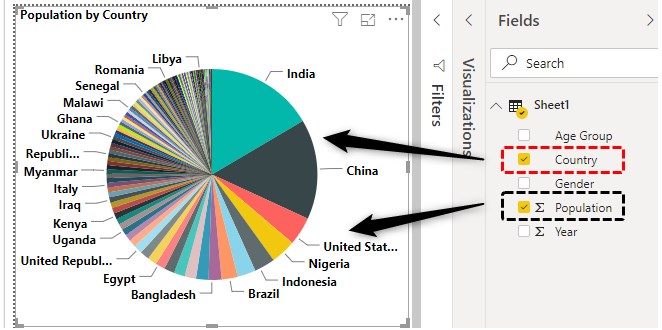
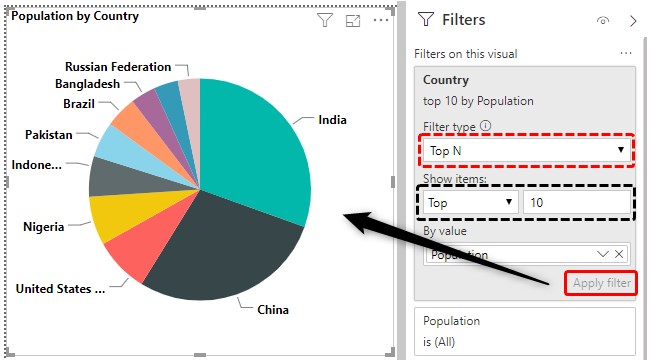
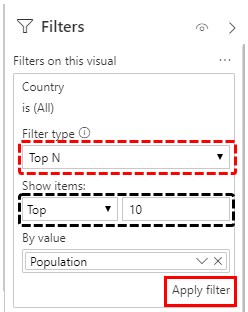
- As we can see, there are so many countries got plotted over a small Pie Chart. Let’s apply the filter now. For this, we will be using different filtering option which is available under the Filter section as shown below.
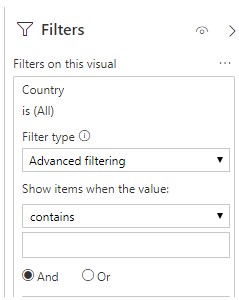
- Now we will filter the Top 10 data set with Population wise. Once done, click on Apply filter.
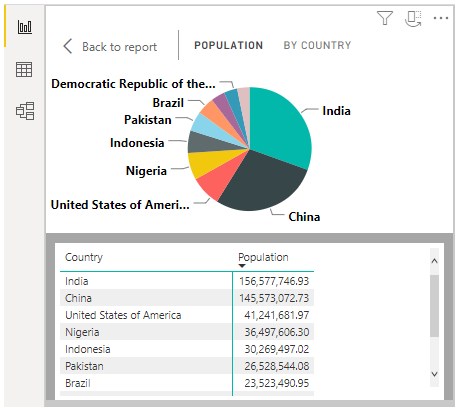
- Now if we want to see the filtered data which is used for creating the updated Pie Chart. Click right on the graph and select Show Data option.
- This will show the data with Country names their population in numbers as shown below.
Example #3
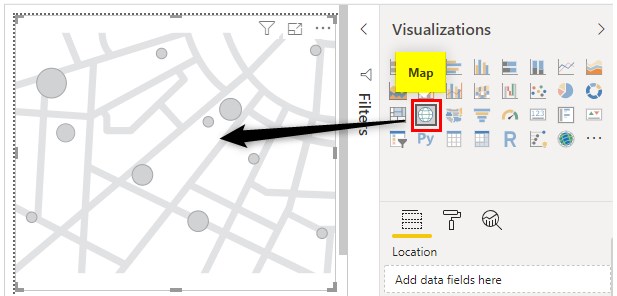
- The above-shown example could be plotted on Map as well using the same parameters.
For this select the Map plot from Visualizations as shown below.
- Let’s select the Fields which we want to see on the map. Here we will be mapping the Country-wise population on the map similar to example 2.
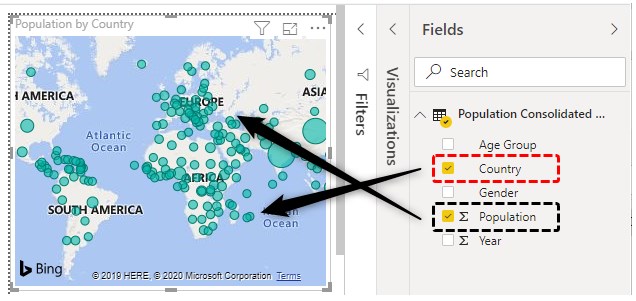
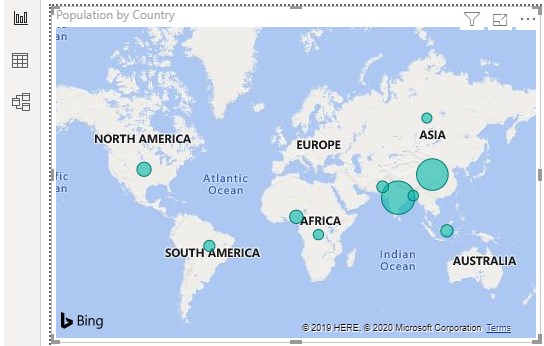
- As we can see our Map chart is quite overloaded with data in many countries. So again, we will apply the same type of filter and get the top 10 country names as shown below.
- We will get the updated map with the top 10 countries on the population parameter.
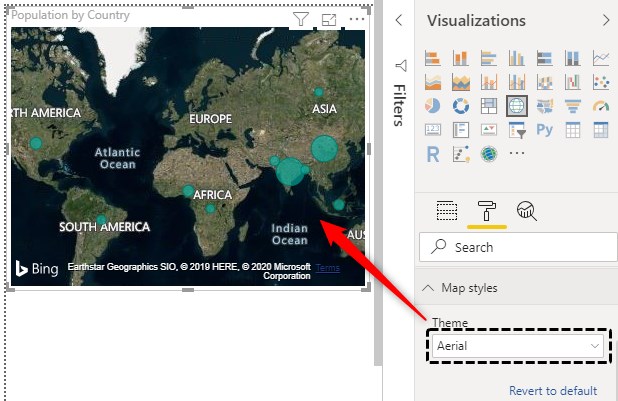
To make this map more beautiful we can change the theme as well. Here we are changing the theme from Road map to Aerial Map from the Visualization section.
- The Aerial Map will look like this as shown below.
Pros of Power BI Visuals
Few pros of Power BI Visuals are explained:
- Power BI Visuals are way better than Excel charts. We can use any type of chart or graph in many ways.
- There is no limitation overusing any chart In Power BI as compared with Excel charts.
- We can change the data, modify and scrub it using DAX and later us it for creating visuals.
- Power BI Visuals are a very strong tool for doing visual analysis.
Things to Remember
- Before using it, first, modify the input data as per requirement. Scrubbing the data before creating graphs is very important.
- We can create any custom visuals using more 2 types of graphs.
- Although we can directly upload the data and start working on creating visual It is highly recommended to learn to format the data before we use it for Visuals.
Recommended Articles
This is a guide to Power BI Visuals. Here we discuss how to use Power BI Visuals along with practical examples like Clustered Column chart, Pie Chart & Map along with downloadable Power BI template. You may also look at the following articles to learn more –
