Definition of Hypothesis in Machine Learning
A hypothesis in machine learning is an initial assumption or proposed explanation regarding the relationship between independent variables (features) and dependent variables (target) within a dataset. It serves as the foundational concept for constructing a statistical model. The hypothesis is formulated to elucidate patterns or phenomena observed in the data and is subject to validation through statistical methods and empirical testing. In the context of machine learning, the hypothesis often manifests as a predictive model, typically represented by a mathematical function or a set of rules.
Throughout the training phase, the machine learning algorithm refines this hypothesis by iteratively adjusting its parameters to minimize the disparity between predicted outputs and actual observations in the training data. Once the model is trained, the hypothesis encapsulates the learned relationship between input features and output labels, enabling the algorithm to generalize its predictions to new, unseen data. Therefore, a well-formulated machine learning hypothesis is testable and can generate predictions that extend beyond the training dataset.
For example, some scientists say we should not eat milk products with fish or seafood. In such a situation, scientists only say combining two food types is dangerous. But people presume it to result in fatal diseases or death. Such assumptions are called hypotheses.
Calculate Hypothesis-
- y = range
- m = slope of the lines
- x = domain
- b = intercept
Table of Contents
- Definition
- Hypothesis in the Machine Learning Workflow
- Hypothesis Testing
- Types of Hypotheses in Machine Learning
- Components of a Hypothesis in Machine Learning
- How does a Hypothesis work
- Hypothesis Testing in Model Evaluation
- Hypothesis Testing and Validation
- Hypothesis in Statistics
- Real-world examples
- Challenges and Pitfalls
Key Takeaways
- A hypothesis in ML is a predictive model or function.
- During training, we fine-tune parameters to achieve accurate predictions.
- Aims to make predictions applicable to new, unseen data.
- We can broadly categorize hypotheses into two types: null hypotheses and alternative hypotheses.
Hypothesis in the Machine Learning Workflow
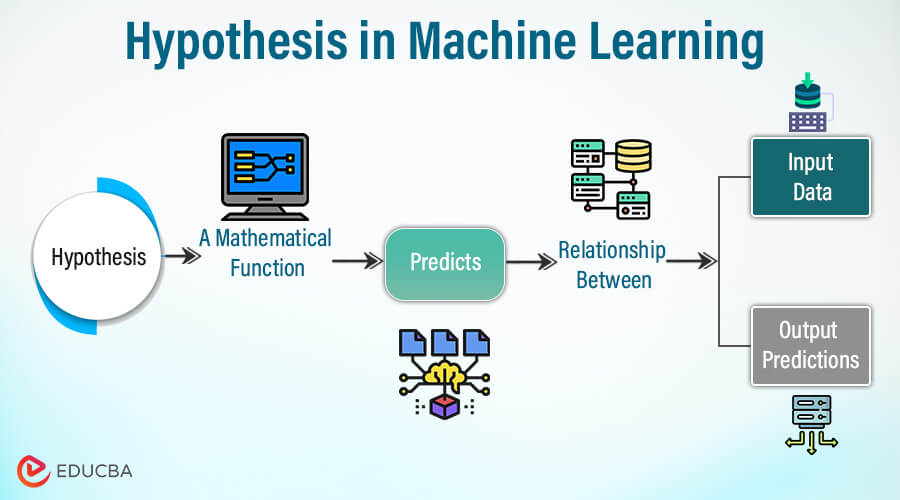
However, in the case of machine learning, the hypothesis is a mathematical function that predicts the relationship between input data and output predictions. The model starts working on the known facts. In machine learning, a hypothesis is like a guess or a proposed idea about how data works. It’s a model we create to make predictions.
We express the hypothesis as a collection of various parameters that impact the model’s behavior. The algorithm attempts to discover a mapping function using the data set. The parameters are modified throughout the learning process to reduce discrepancies between the expected and actual results. The goal is to fine-tune the model so it predicts well on new data, and we use a measure (cost function) to check its accuracy.
Let us help it using the following example.
Imagine you want to predict students’ exam scores based on their study hours. Your hypothesis could be.
Predicted Score=Study Hours× (x)
The hypothesis suggests that the more hours a student studies, the higher their exam score. The “(x)” is what the machine learning algorithm will figure out during training. You collect data on study hours and actual exam scores, and the algorithm adjusts the “(x)” to make the predictions as accurate as possible. This process of changing the hypothesis is at the core of machine learning.
Hypothesis Testing
Hypothesis testing refers to the systematic approach to determine if the findings of a specific study validate the researcher’s theory regarding a population. You can say that hypothetical testing is just an assumption made about a population parameter.
To conduct a hypothesis on a population, researchers or scientists perform hypothesis testing on sample data. Then, they evaluate the assumptions against the evidence. It includes evaluating two mutually exclusive statements regarding the population to determine which is best supported by the sample data.
Types of Hypotheses in Machine Learning
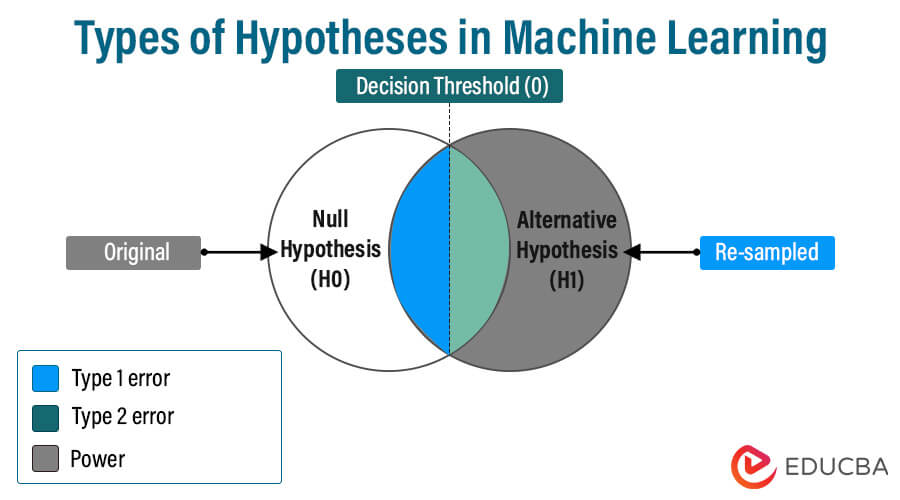
In machine learning, We can broadly categorize hypotheses into two types: null hypotheses and alternative hypotheses. The null and alternative hypotheses are distinct statements regarding a population. Through a hypothesis test, sample data decides whether to reject the null hypothesis.
1. Null Hypothesis (H0): In this hypothesis, all samples exhibit identical characteristics or variables about a population. It posits no relationship between sample parameters and the dependent and independent variables. When there are negligible distinctions between the two means or the difference lacks significance, it aligns with the null hypothesis.
The new study method has no significant effect on exam scores compared to the traditional method.
2. Alternative Hypothesis (H1 or Ha): this hypothesis contradicts the case of the null hypothesis, saying that the actual value of a population parameter is different from the null hypothesis value.
The new study method is more effective, leading to higher exam scores than the traditional method.
Where (new method) is the average exam score of students using the new study method. And the (traditional method) is the average exam score of students using the traditional study method.
The null hypothesis assumes no divergence in average exam scores between the new and traditional study methods. In contrast, the alternate hypothesis proposes a positive difference, implying the new study method is more effective. The goal of data gathering and statistical testing is to ascertain whether there is enough evidence to reject the null hypothesis. Supporting the notion that the new study method is superior in enhancing exam scores.
Components of a Hypothesis in Machine Learning
Below are the core components of testing a hypothesis.
- Level of Significance
It signifies the probability of rejecting the null hypothesis if it is true. (Alpha) represents the threshold for accepting or rejecting a hypothesis.
For example, a significance level of 0.05 (5%) implies 95% confidence in the results, meaning even if we repeat the test numerous times, 95% of the outcomes would fall within the accepted range.
- P-value
It refers to the probability of getting outputs as extreme as the observed ones, where we assume the null hypothesis is true. In case the P-value surpasses the selected significance level (α), the null hypothesis is rejected.
For Example, A P-value of 0.03 suggests a 3% chance of obtaining the observed results if the null hypothesis is correct. If α is 0.05, the P-value is less than α, indicating a rejection of the null hypothesis.
- Test Statistic
Refers to the numerical value calculated from the sample datasets during hypothesis testing. The test statistics formula assesses the deviation of the sample data from the null hypothesis’ expected values.
For example, in a t-test, the test statistic may be the t-value, calculated by comparing the means of two groups and assessing if the difference is statistically significant.
- Critical Value
It refers to the pre-defined threshold value that will help you decide whether to reject or accept the null hypothesis. You must reject the null hypothesis if the test statistic exceeds the critical value.
For Example, In a z-test, if the test statistic is greater than the critical value for a 95% confidence level, the null hypothesis is rejected.
- Degrees of Freedom
Degrees of freedom refer to the variability in estimating a parameter, often linked to sample size. In hypothesis testing, degrees of freedom affect the shape of the distribution.
For Example, In a t-test, you can determine the degrees of freedom using the sample size and impact the critical values. The larger degrees of freedom provide more precision in estimating population parameters.
How does a Hypothesis work?
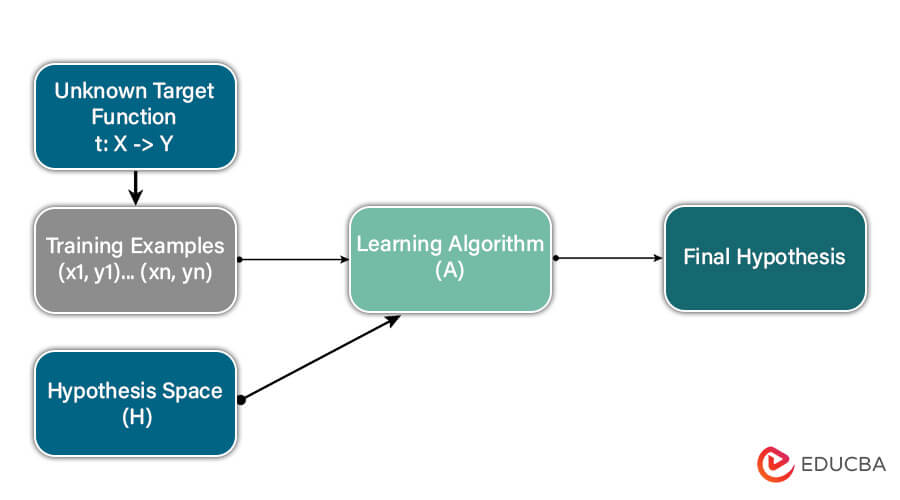
In many machine learning methods, our main aim is to discover a hypothesis (a potential solution) from a set of possible solutions. The goal is to find a hypothesis that accurately connects the input data to the correct outcomes. The process typically involves exploring various hypotheses in a space of possibilities to identify the most suitable one.
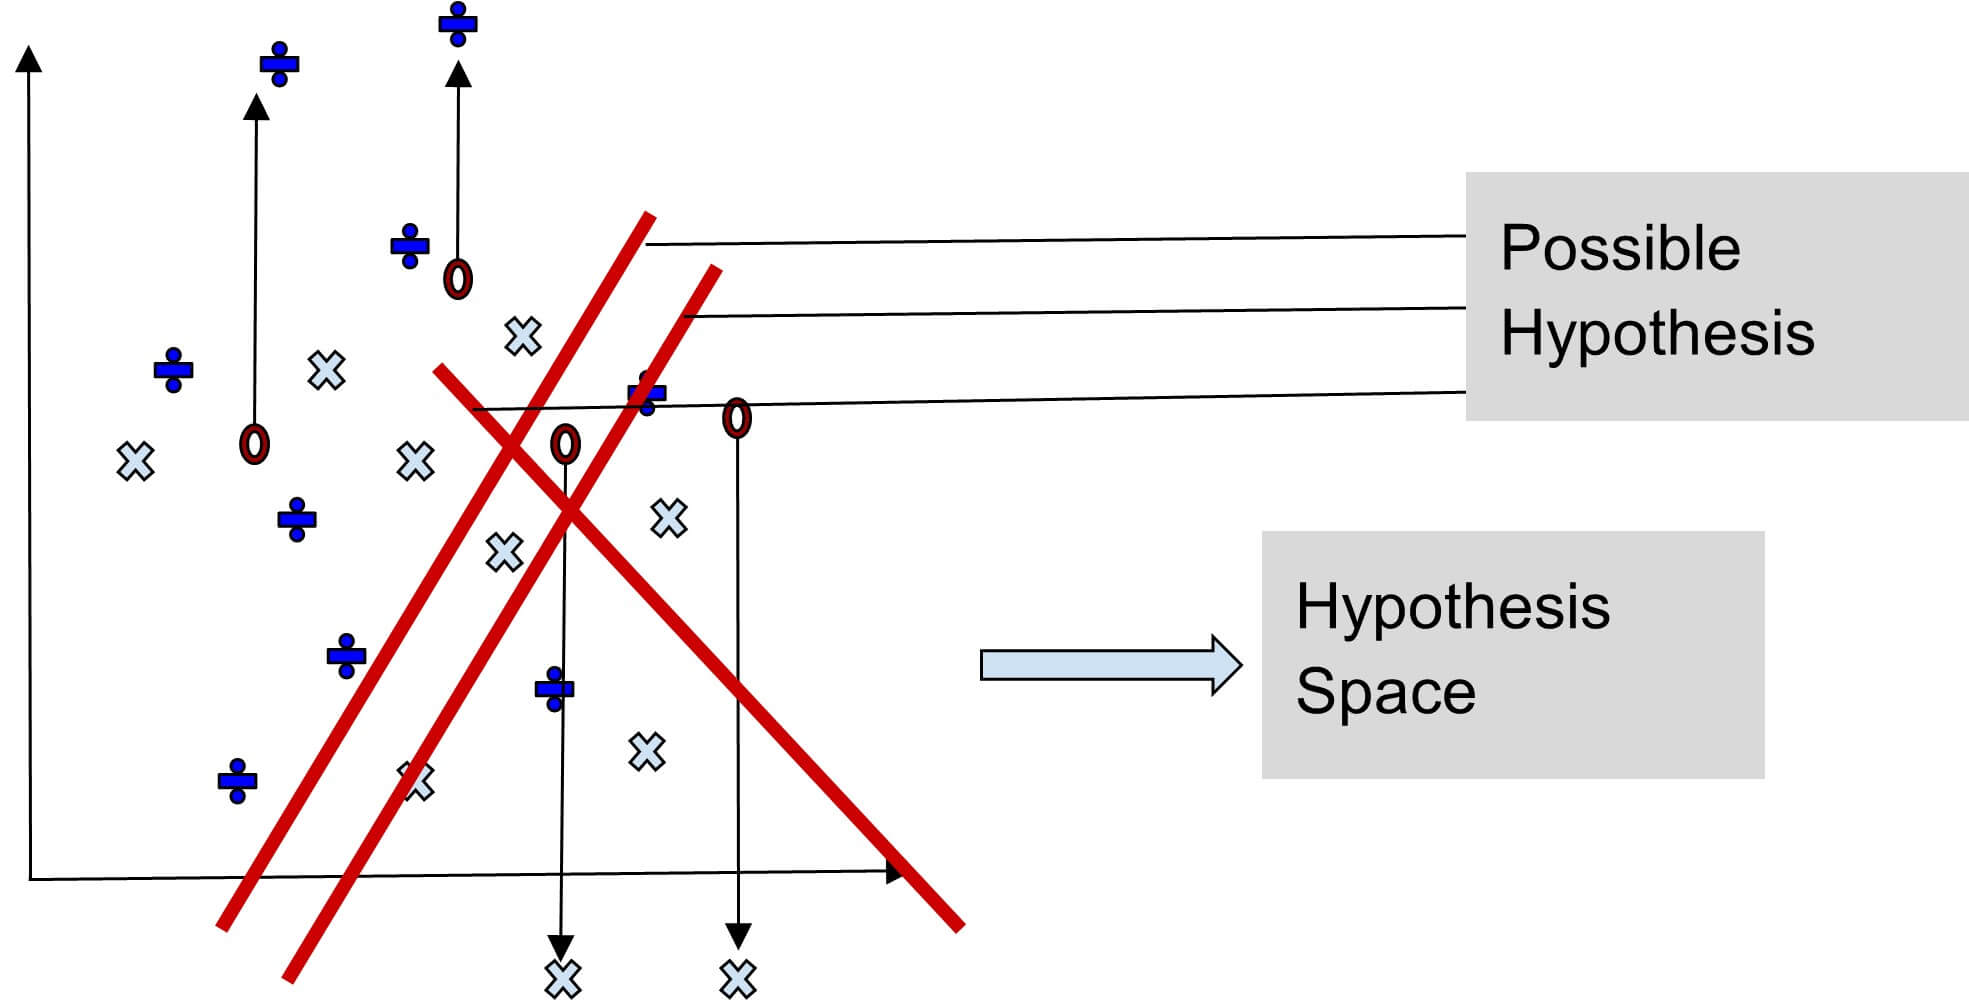
Hypothesis Space (H)
The “hypothesis space” collects all the allowed guesses a machine learning system can make. The algorithm picks the best guess for this set’s expected outcomes or results.
Hypothesis (h)
In supervised machine learning, a hypothesis is like a function that tries to explain the expected outcome. We influence the specific function the algorithm picks based on the data and any limitations or preferences we’ve set. The formula for this function can be expressed as
In this formula,
- y represents the predicted outcome,
- m represents the line slope,
- x refers to the input,
- b is the intercept.
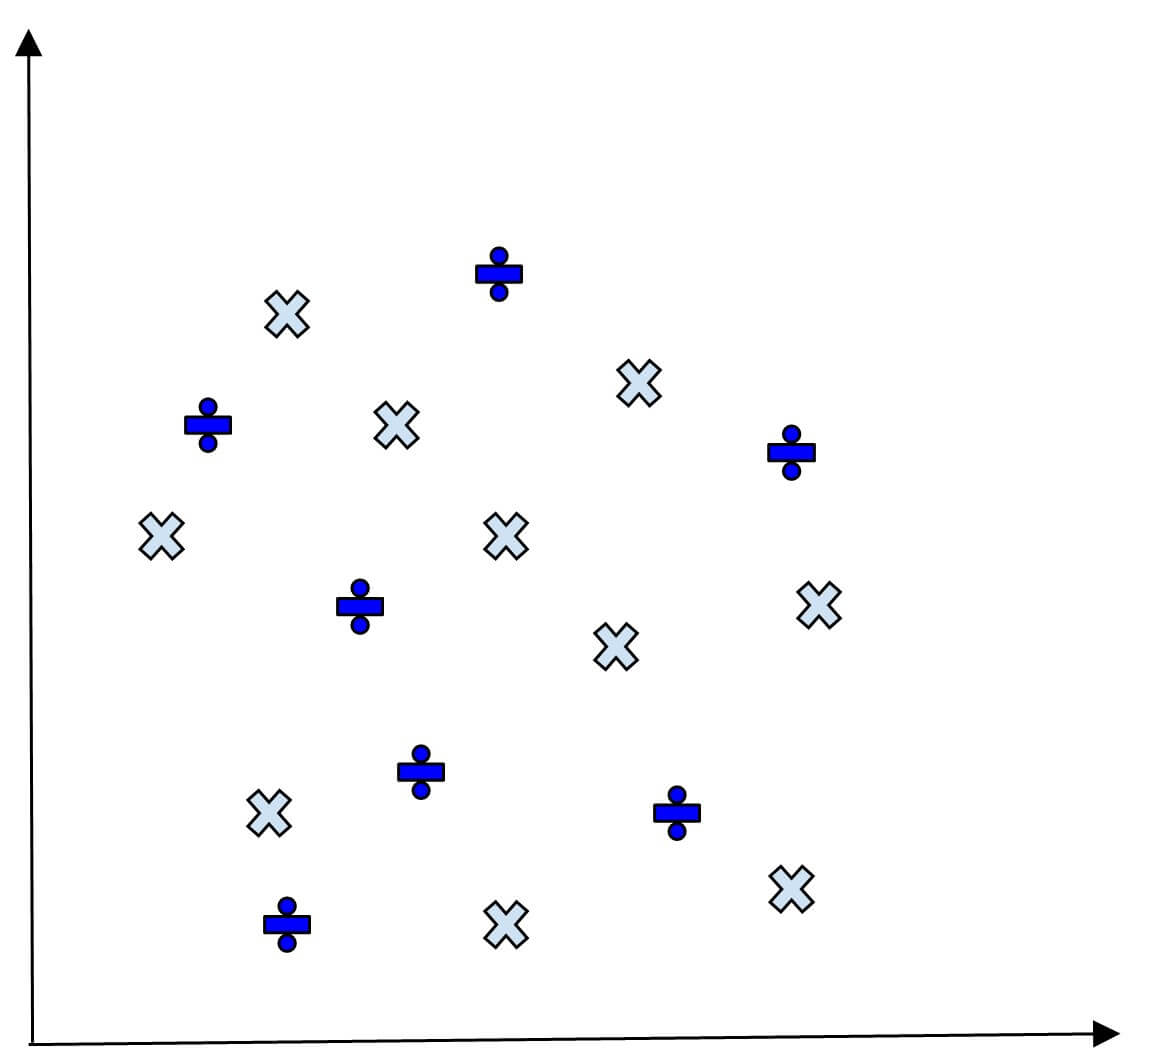
Let us explain the concepts of (h) and (H) using the following coordinates.
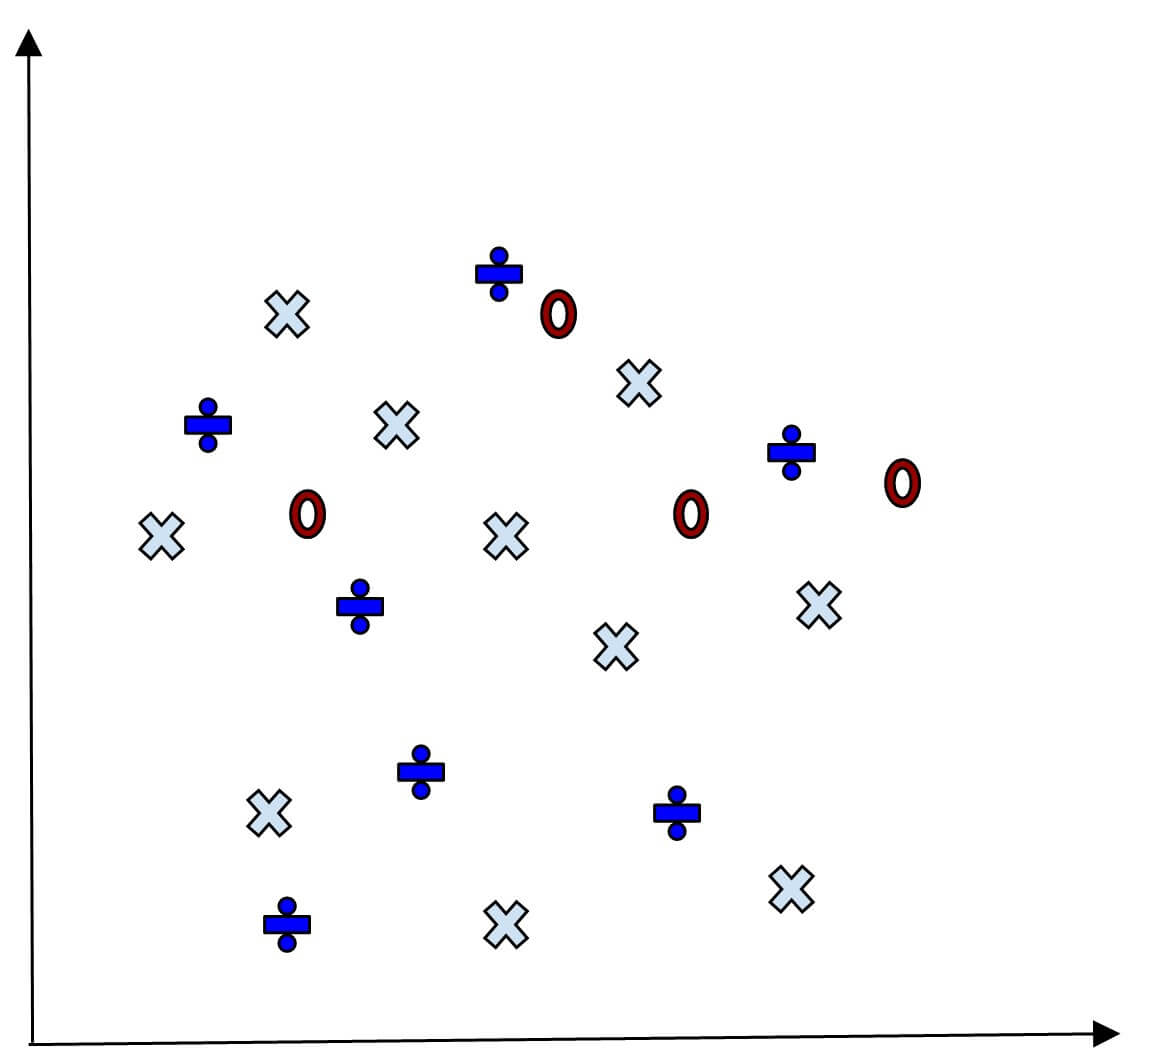
Consider that we have some test data for which we have to identify the result. See the below image with test data.
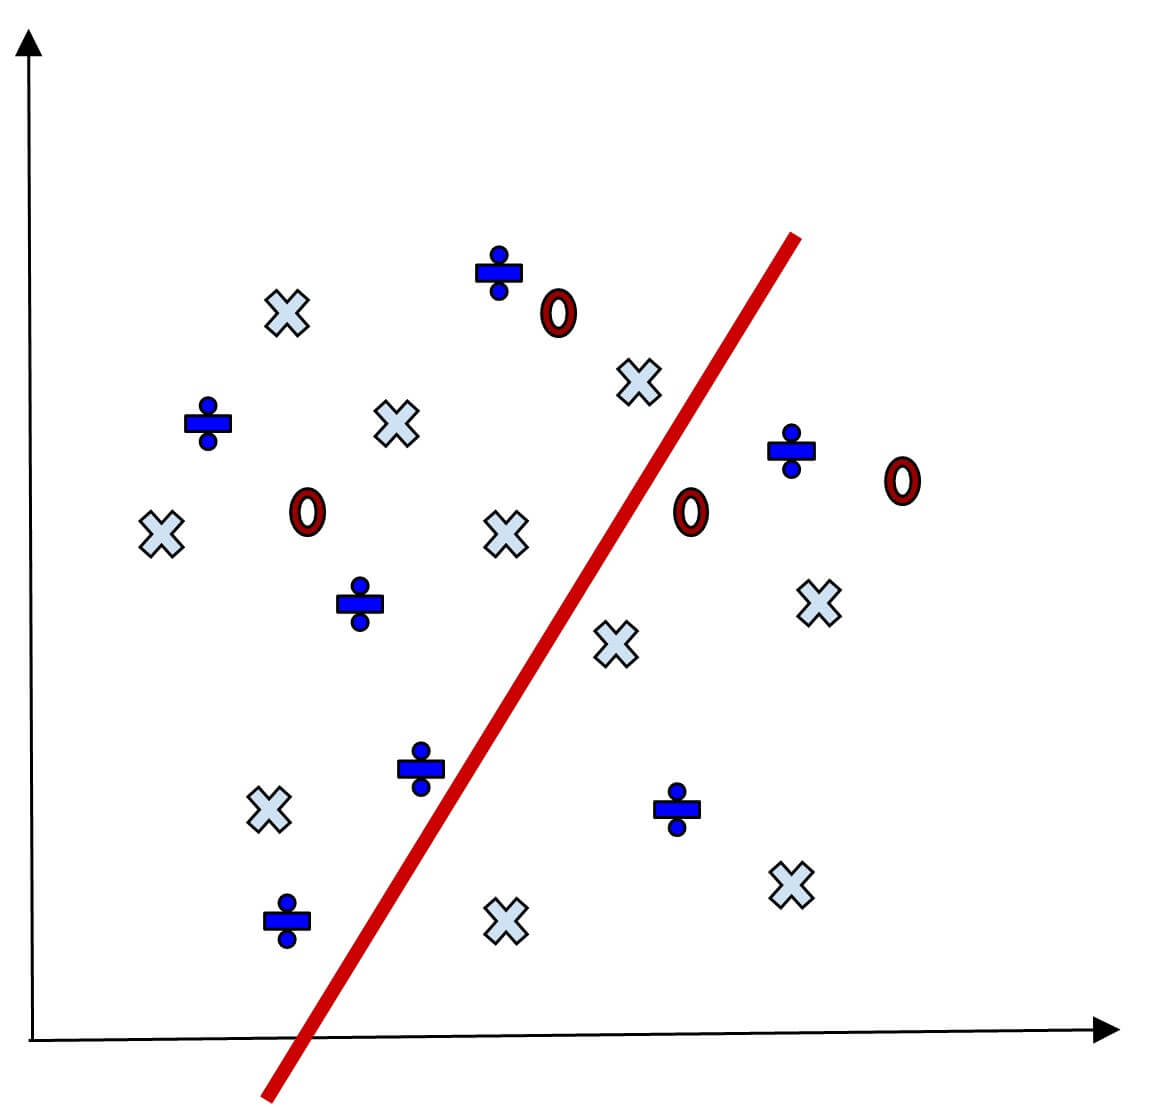
Now, we divide the coordinates to predict the outcome.
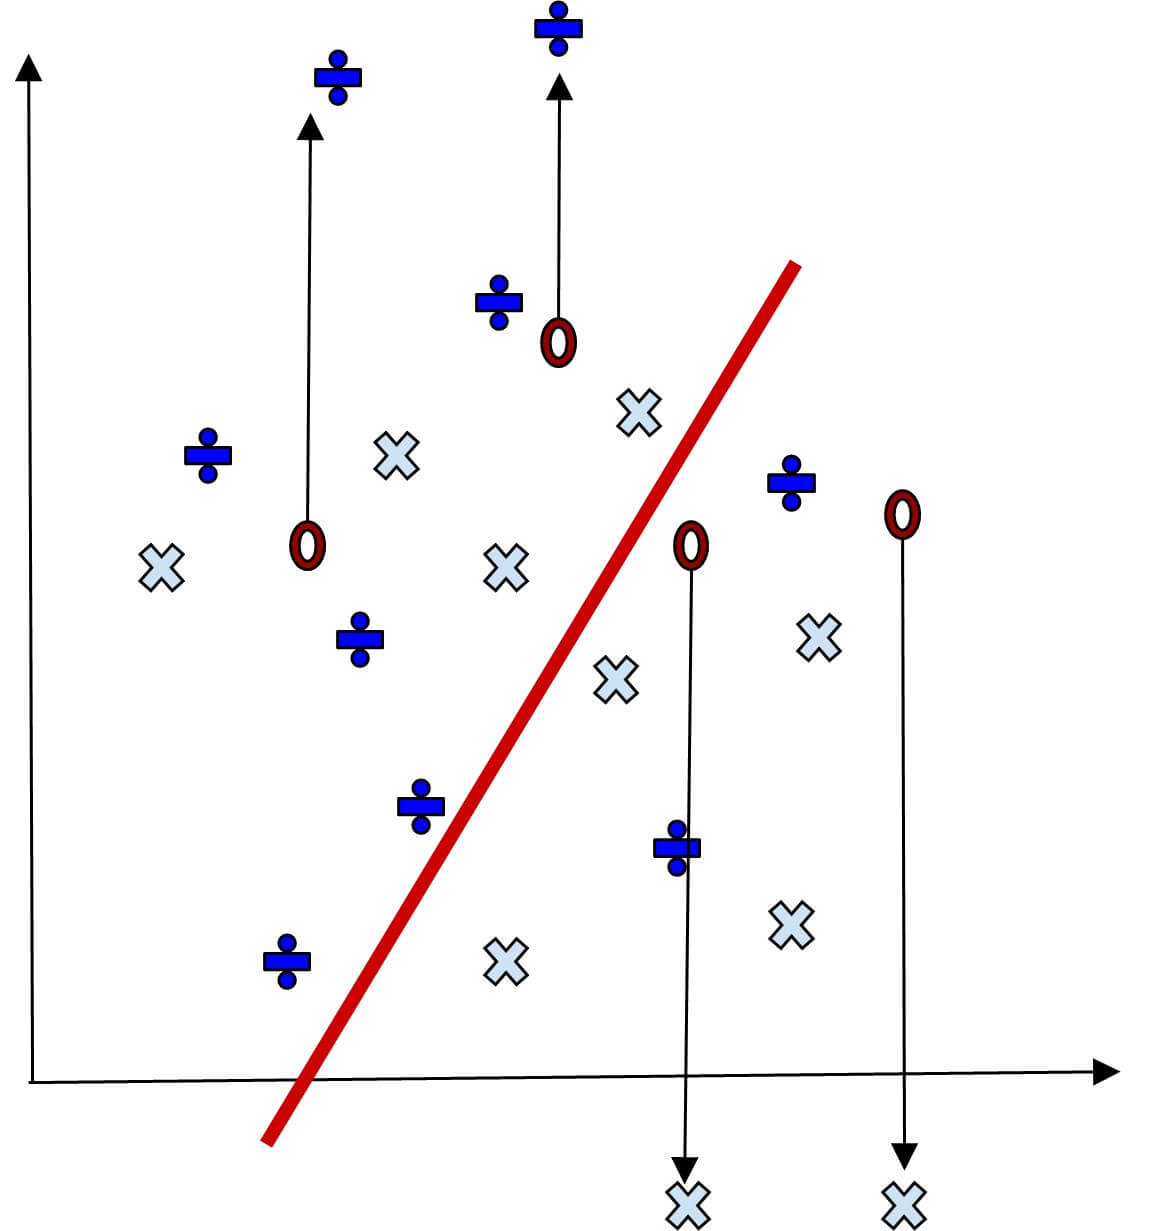
The below image will reflect the test data result.
How we split the coordinate plane to make predictions depends on the data, algorithm, and rules we set. The collection of all the legal ways we can divide the plane to predict test data outcomes is called the Hypothesis Space. Each specific way is called a hypothesis. In this example, the hypothesis space is like-
Hypothesis Testing in Model Evaluation
Hypothesis testing in model evaluation involves formulating assumptions about the model’s performance based on sample statistics and rigorously evaluating these assumptions against empirical evidence. It helps determine whether observed differences between model outcomes and expected results are statistically significant. This statistical method checks the validity of hypotheses regarding the model’s predictive accuracy. It also provides a systematic approach to determining the model’s effectiveness in new, unseen data.
For example, we are testing a new model that predicts whether emails are spam.
Hypotheses
- Null Hypothesis (H0): The new model is insignificant to the existing one.
- Alternative Hypothesis (H1): The new model is better than the existing one.
Procedure
- Train both models on a dataset.
- Collect predictions on a sample of emails from each model.
- Use hypothesis testing to assess if the differences in prediction accuracy are statistically significant.
Outcome
- Reject H0: If the new model’s improvement is statistically significant, you may conclude it performs better.
- Fail to Reject H0: If there’s no significant improvement, you might stick with the existing model.
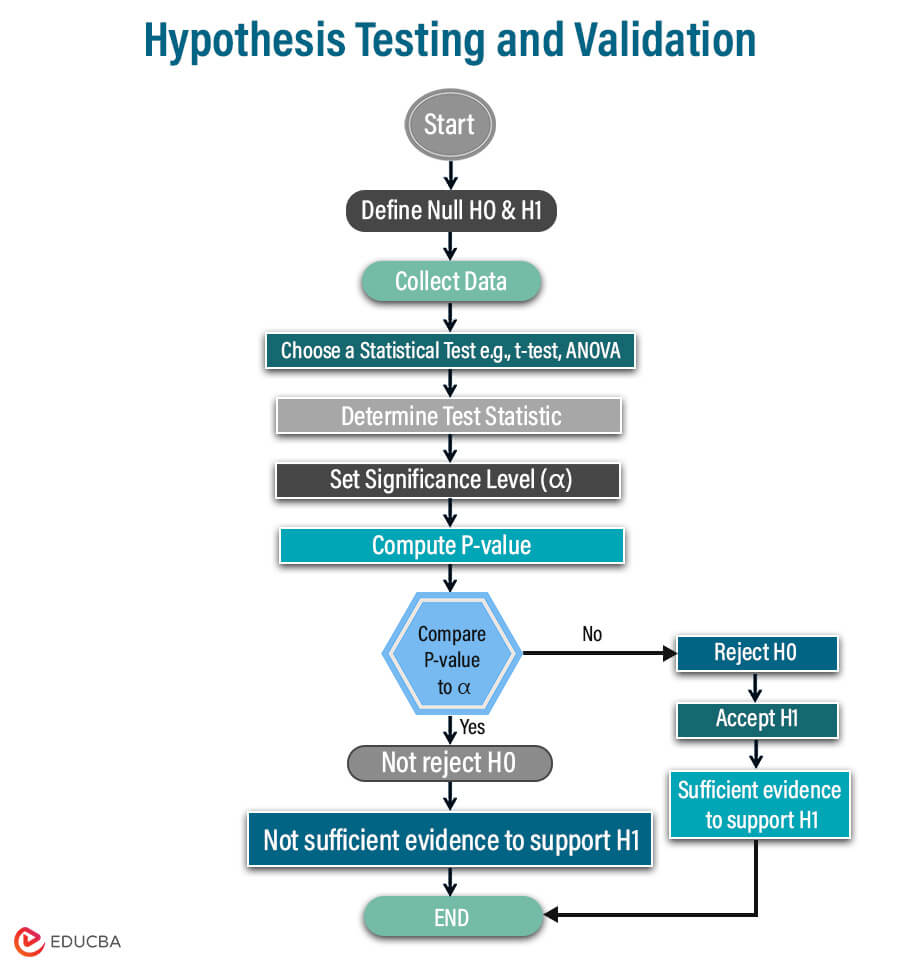
Hypothesis Testing and Validation
Below are the steps included in conducting detailed hypothesis testing.
1. Define null and alternate hypotheses.
The first step is to develop the prediction that you want to investigate. Based on that, create your null and alternate hypothesis to test it mathematically based on the data sets provided on a specific population.
Where the null hypothesis predicts no relationship between that population’s variables, an alternate hypothesis predicts if any relationship exists.
For example, testing a relationship between gender and height. For that, you hypothesize that men are, on average, taller than women.
H0- men are, on average, shorter than women.
H1- men are, on average, taller than women.
2. Find the right significance level.
Now, you must select the significance level (α), say 0.05. This number will set the threshold to reject the null hypothesis. It validates the hypothesis test, ensuring we have enough information to support our prediction. You must identify your significance level before starting the test using the p-value.
3. Collect sufficient data or samples.
To perform accurate statistical testing, you must do the correct sampling and collect data in such a way that it will complement your hypothesis. If your data is inaccurate, you might not be able to derive the right result for that specific population you want.
For example- To compare the average height of men and women, ensure an equal representation of both genders in your sample. Include diverse socio-economic groups and control variables. Consider the scope (global or specific country) and use census data for regions and social classes in multiple countries.
4. Calculate test statistic.
The T-statistic measures how different the averages of the two groups are, considering the variability within each group. The calculation involves dividing the difference in group averages by the standard error of the difference. People also call it the t-value or t-score.
Now, we analyze data for different scores based on their characteristics to perform hypothesis tests. The selection of the test statistic relies on the specific type of hypothesis test we are carrying out. Various tests, like the Z-test, Chi-square, T-test, etc., are employed based on the goals of the analysis.
| Statistical Test | Formula | Meaning |
| Z-Test | Measures how many standard deviations a data point or sample mean is from the population mean. | |
| T-Test | Considering sample variability, assess if the means of the two groups are significantly different. | |
| Chi-Square Test | Identifies whether a significant relationship between two categorical variables exists within a contingency table. | |
| ANOVA | Compares the means of more than two groups to evaluate if there are significant differences. | |
| Pearson Correlation | Calculates the strongness and direction of a linear relationship between two continuous variables. |
We conducted a one-tailed t-test to check if men are taller than women. Results indicate an estimated average height difference of 13.7 cm, with a p-value of 0.002. The observed difference is statistically significant, suggesting men tend to be taller than women in the sample.
5. Compare the test statistics.
Comparing test statistics involves evaluating the obtained test statistic with critical values or p-values to decide the null hypothesis. The comparison method depends on the type of statistical test we are conducting.
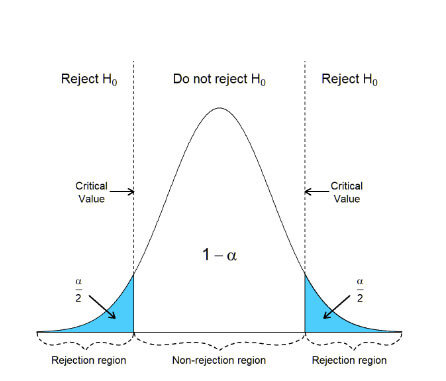
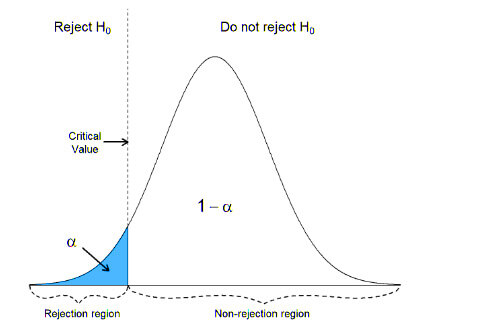
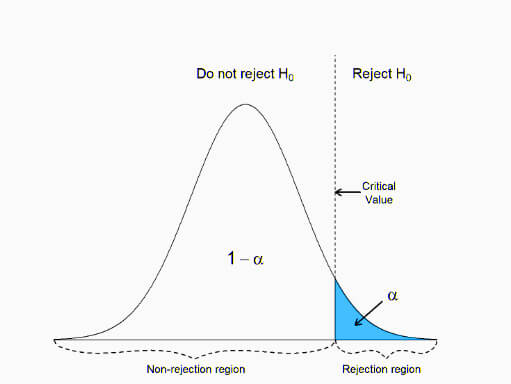
Method 1- using critical values
Identify the critical value(s) from the distribution associated with your chosen significance level (alpha).
- If the absolute value of your calculated test statistic is greater than the critical value(s), you reject the null hypothesis.
- If the test statistic falls within the non-rejection region defined by the critical values, you fail to reject the null hypothesis.
In a two-sided test, the null hypothesis gets rejected if the calculated test statistic is either excessively small or large. Consequently, we divide the rejection region for this test into two parts, one on the left and one on the right.
In a left-tailed test, we reject the null hypothesis only if the test statistic is minimal. As such, for this kind of test, only one portion of the rejection region lies to the left of the center.
If the test statistic in a right-tailed test is significant, we reject the null hypothesis. As such, only one portion of the rejection region for this test is located to the right of the center.
Method 2- p-value approach
In the p-value approach, we assess the probability (p-value) of the test statistic’s numerical value compared to the hypothesis test’s predetermined significance level (α).
The p-value reflects the likelihood of observing sample data as extreme as the obtained test statistic. Lower p-values mean slight chances in favor of the null hypothesis. The closer the p-value is to 0, the more compelling the evidence against the null hypothesis.
If the p-value is less than or equal to the specified significance level α, we reject the null hypothesis. Conversely, if the p-value exceeds α, we do not deny the null hypothesis.
For example- analysis reveals a p-value of 0.002, below the 0.05 cutoff. Consequently, you reject the null hypothesis, indicating a significant difference in average height between men and women.
6. Present findings:
You can present the findings of your hypothesis testing, explaining the data sets, result summary, and other related information. Also, explain the process and methods involved to support your hypothesis.
In our study comparing the average height of men and women, we identified a difference of 13.7 cm with a p-value of 0.002. This study leads us to reject the idea that men and women have equal height, indicating a probable difference in their heights.
Hypothesis in Statistics:
A hypothesis denotes a proposition or assumption regarding a population parameter, guiding statistical analyses. There are two categories: the null hypothesis (H0) and the alternative hypothesis (H1 or Ha).
- The null hypothesis (H0) posits no significant difference or effect, attributing observed results to chance, often representing the status quo or baseline assumption.
- Conversely, the alternative hypothesis (H1 or Ha) opposes the null hypothesis, suggesting a significant difference or effect in the population and aiming for support with evidence.
Real-world examples
Example 1- Impact of a Training Program on Employee Productivity
Suppose a company introduces a new training program to improve employee productivity. Before implementing the program across the organization, they conduct a study to assess its effectiveness.
Data:
Before Training: [120, 118, 125, 112, 130, 122, 115, 121, 128, 119]
After Training: [130, 135, 142, 128, 125, 138, 130, 133, 140, 129]
Steps:
Step 1: Define the Hypothesis
Null Hypothesis (H0): The training program does not affect employee productivity.
Alternate Hypothesis (H1): The training program positively affects employee productivity.
Step 2: Define the Significance Level.
Let’s consider the significance level at 0.05, indicating rejection of the null hypothesis if the evidence suggests less than a 5% chance of observing the results due to random variation.
Step 3: Compute the Test Statistic (T-statistic)
The formula for the T-statistic in a paired T-test is given by:
Where:
m = mean of the difference i.e, Xafter, Xbefore
s = standard deviation of the difference (d),
n = sample size,
mean_difference = np.mean(after_training – before_training)
std_dev_difference = np.std(after_training – before_training, ddof=1) # using ddof=1 for sample standard deviation
n_pairs = len(before_training)
t_statistic_manual = mean_difference / (std_dev_difference / np.sqrt(n_pairs))
Step 4: Find the P-value
Calculate the p-value using the test statistic and degrees of freedom.
df = n_pairs – 1
p_value_manual = 2 * (1 – stats.t.cdf(np.abs(t_statistic_manual), df))
Step 5: Result
- If the p-value is less than or equal to 0.05, reject the null hypothesis.
- If the p-value is greater than 0.05, fail to reject the null hypothesis.
Example using Python
import numpy as np
From Scipy import stats
# Data
before_training = np.array([120, 118, 125, 112, 130, 122, 115, 121, 128, 119])
after_training = np.array([130, 135, 142, 128, 125, 138, 130, 133, 140, 129])
# Step 1: Null and Alternate Hypotheses
null_hypothesis = “The training program has no effect on employee productivity.”
alternate_hypothesis = “The training program has a positive effect on employee productivity.”
# Step 2: Significance Level
alpha = 0.05
# Step 3: Paired T-test
t_statistic, p_value = stats.ttest_rel(after_training, before_training)
# Step 4: Decision
if p_value <= alpha:
decision = “Reject”
else:
decision = “Fail to reject”
# Step 5: Conclusion
if decision == “Reject”:
conclusion = “It means the training program has a positive effect on employee productivity.”
else:
conclusion = “There is insufficient evidence to claim a significant difference in employee productivity before and after the training program.”
# Display results
print(“Null Hypothesis:”, null_hypothesis)
print(“Alternate Hypothesis:”, alternate_hypothesis)
print(f”Significance Level (alpha): {alpha}”)
print(“\n— Hypothesis Testing Results —“)
print(“T-statistic (from scipy):”, t_statistic)
print(“P-value (from scipy):”, p_value)
print(f”Decision: {decision} the null hypothesis at alpha={alpha}.”)
print(“Conclusion:”, conclusion)
Challenges and pitfalls
- Failure to Capture Underlying Patterns
Some hypotheses or models may not effectively capture the actual patterns based on the available data. This failure results in poor model performance, as the predictions may need to align with the actual outcomes.
Example: If a linear regression model is used to fit a non-linear relationship, it might fail to capture the underlying complexity in the data.
- Biased Training Data
The training data used to develop a model may contain biases, reflecting historical inequalities or skewed representations. Biased training data can lead to unfair predictions, especially for underrepresented groups, perpetuating or exacerbating existing disparities.
Example: If a facial recognition system is trained mainly on a specific demographic, it may need help accurately recognizing faces from other demographics.
- Poor-quality data:
Data with noise, inaccuracies, or missing values can negatively affect the model’s performance. Only reliable input data can ensure the accuracy of the hypotheses or predictions.
Example: A weather prediction model may need help to provide accurate forecasts in a dataset with inconsistent temperature recordings.
- Inclusion of Irrelevant or Redundant Features:
Including too many irrelevant or redundant features in the model can hamper its performance. Unnecessary features may introduce noise, increase computational complexity, and hinder the model’s generalization ability.
Example: In a spam email classification model, including irrelevant metadata might not contribute to accurate spam detection.
- Assumptions about Data Distribution:
Making assumptions about data distribution that do not hold true can lead to unreliable hypotheses. Models relying on incorrect assumptions may fail to make accurate predictions.
Example: Assuming a normal distribution when skewed data could result in misinterpretations and poor predictions.
- Evolution of Data
Over time, the characteristics and patterns in the data may change. Hypotheses developed based on outdated data may lose their relevance and accuracy.
Example: Economic models trained on historical data might not accurately predict market trends if there are significant changes in economic conditions.
- Complex Models with Low Interpretability
Some advanced models, like deep neural networks, can be complex and challenging to interpret. Understanding and explaining the decisions of such models becomes difficult, particularly in regulated or sensitive domains where transparency is crucial.
Example: In healthcare, a highly complex model for disease prediction may provide accurate predictions but needs more transparency in explaining why a specific patient received a particular diagnosis.
Conclusion
Hypothesis testing is a cornerstone in machine learning, guiding model assessment and decision-making. It addresses overfitting risks, assesses the significance of performance differences, and aids in feature selection. With its versatility, it ensures robust evaluations across various ML tasks. The interplay between significance levels, model comparisons, and ethical considerations underscores its importance in crafting reliable and unbiased predictive models, fostering informed decision-making in the dynamic landscape of machine learning.
Frequently Asked Questions (FAQs)
Q1. Can hypothesis testing be applied to compare different machine-learning algorithms?
Answer: Yes, you can use hypothesis testing to compare the performance of various ML algorithms, providing a statistical framework to determine if observed differences in predictive accuracy are significant and not random fluctuations.
Q2. How can hypothesis testing assist in feature selection in machine learning?
Answer: You can use Hypothesis testing to evaluate the significance of individual features in a model. It aids in the selection of pertinent features and the removal of those that have little bearing on prediction accuracy.
Q3. How can continuous monitoring and adaptation be integrated with hypothesis testing in machine learning?
Answer: Continuous monitoring involves regularly reassessing model hypotheses to adapt to evolving data dynamics. Hypothesis testing is a systematic tool to evaluate ongoing model performance, ensuring timely adjustments and sustained reliability in predictive outcomes.
Recommended Articles
We hope that this EDUCBA information on “Hypothesis in Machine Learning” was beneficial to you. You can view EDUCBA’s recommended articles for more information.

