Updated July 24, 2023
Pearson Correlation Coefficient Formula (Table of Contents)
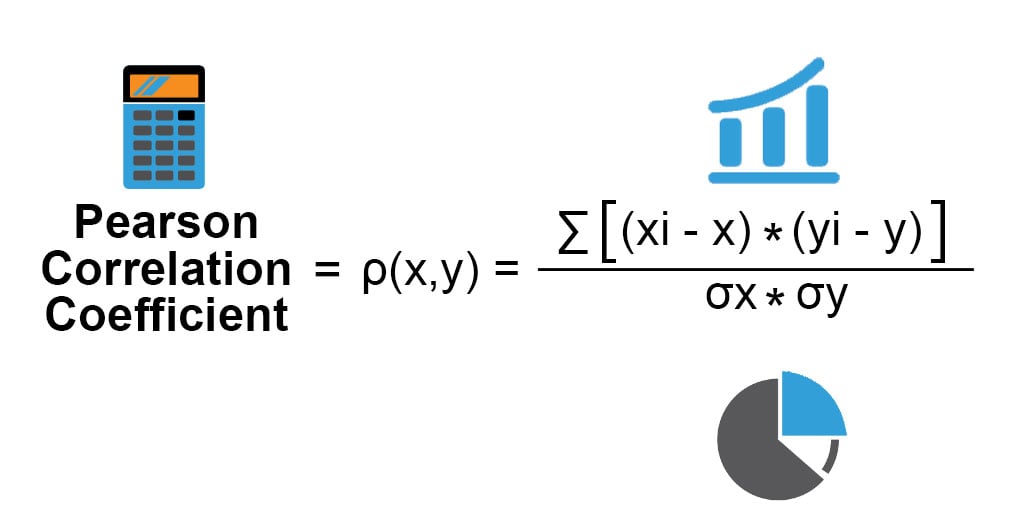
What is the Pearson Correlation Coefficient Formula?
The Pearson Correlation Coefficient is used to identify the strength of a linear interrelation between two variables; we don’t need to measure if there is no linear relation between two variables. It’s also called a product-moment correlation coefficient (PMCC) and denoted by “r” and is frequently used as a statistical measure. The correlation coefficient for continuous data scales lies between -1 to +1.
If the value is near positive 1, this means there is a perfect positive interrelation between the two variables; it indicates that if one variable increases positively, the other variable also increases in the same direction. Conversely, if the value is near negative 1, there is a perfect negative correlation. This indicates that if one variable increases positively, the other will decrease perfectly in the opposite direction. If the value is 0, there is no interrelation between the two variables.
Formula,
Where,
x̄ = Mean of x variable
ȳ = Mean of y variable
Example of Pearson Correlation Coefficient Formula (With Excel Template)
Let’s take an example to understand the calculation of the Pearson Correlation Coefficient in a better manner.
Pearson Correlation Coefficient Formula – Example #1
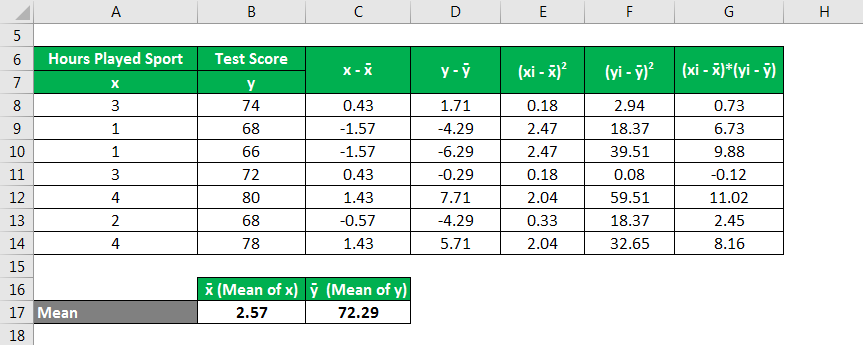
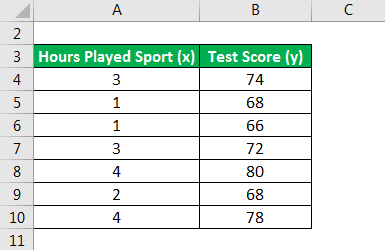
Let’s take a simple example to understand the Pearson correlation coefficient. Mark is a scholar student, and he is good at sports as well. But after some time, he reduced his sports activity and then observed that he scored lesser marks in tests. To test his hypothesis, he tracked how he scored in his tests based on how many hours he played any sport before he appeared in the school tests. He gathered the following data to check the correlation between the hours of sports he is playing and his tests score.
Solution:
Sum(x,y) Variable calculation:
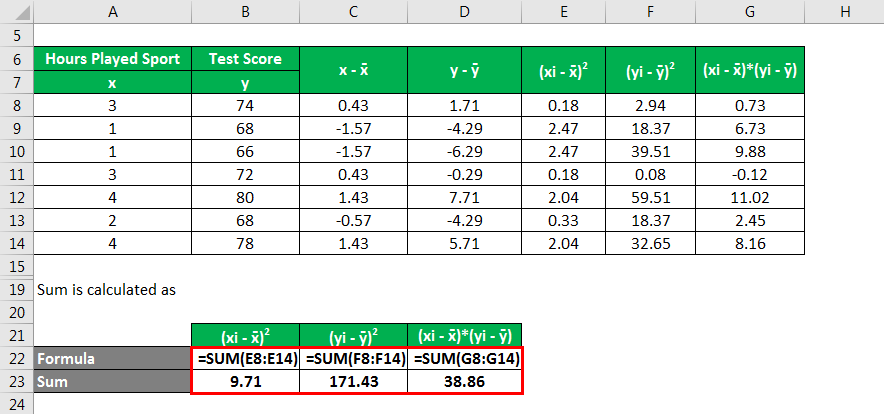
S(x,y) Variable =38.86
Standard Deviation of x calculation:
- Standard Deviation x = (xi – x̄)2
- Standard Deviation y = (yi – ȳ)2
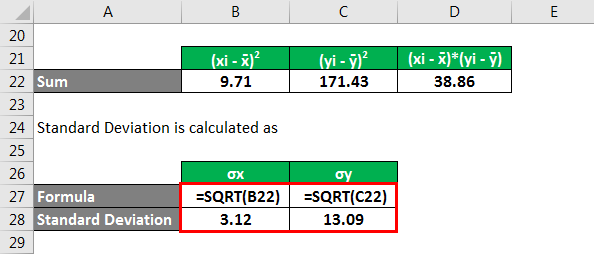
- Standard Deviation x = 3.12
- Standard Deviation y= 13.09
The formula to calculate Pearson Correlation Coefficient is as below:
Pearson Correlation Coefficient = ρ(x,y) = Σ(xi – x̄)(yi – ȳ) / σx*σy
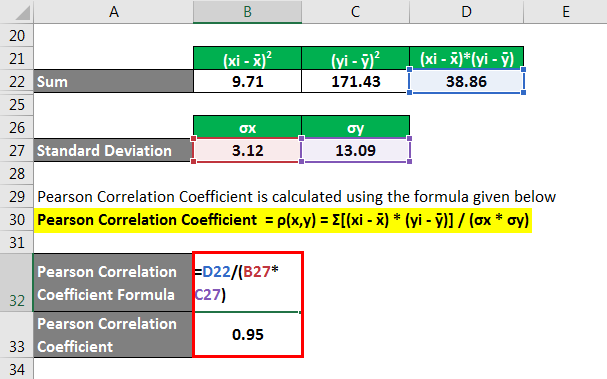
- Pearson Correlation Coefficient = 38.86/(3.12*13.09)
- Pearson Correlation Coefficient = 0.95
We have an output of 0.95; this indicates that the test scores also increase when the number of hours played increases. These two variables are positively correlated.
Pearson Correlation Coefficient Formula – Example #2
Let’s take the same example and calculate Pearson’s Correlation Coefficient by using an Excel formula.
Solution:
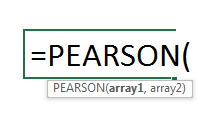
We need to apply a simple formula to calculate the Pearson correlation coefficient in Excel.
Pearson Correlation Coefficient calculation:
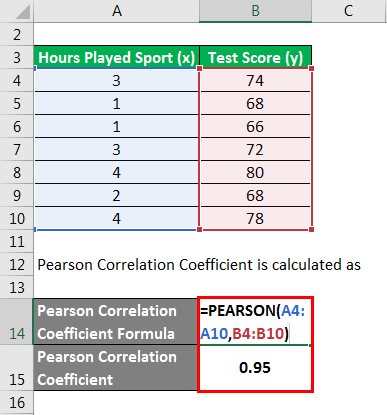
Pearson Correlation Coefficient = 0.95.
Where array 1 is a set of independent variables and array 2 is a set of independent variables. In this example, we calculated the same 1st example with the Excel method and got the same result, i.e. 0.95.
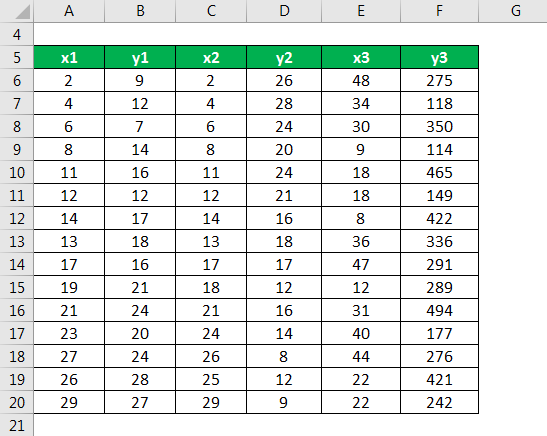
Pearson Correlation Coefficient Formula – Example #3
In our last example, we will not perform calculations and understand as well as analyze the various interrelation between variables and their correlation coefficients with the help of the scatter diagram. We are looking at three different data sets and plotting them on a scatter graph.
Solution:
Calculating the Pearson Correlation Coefficient using Excel formula.
Pearson Correlation Coefficient = PEARSON(array1,array2)
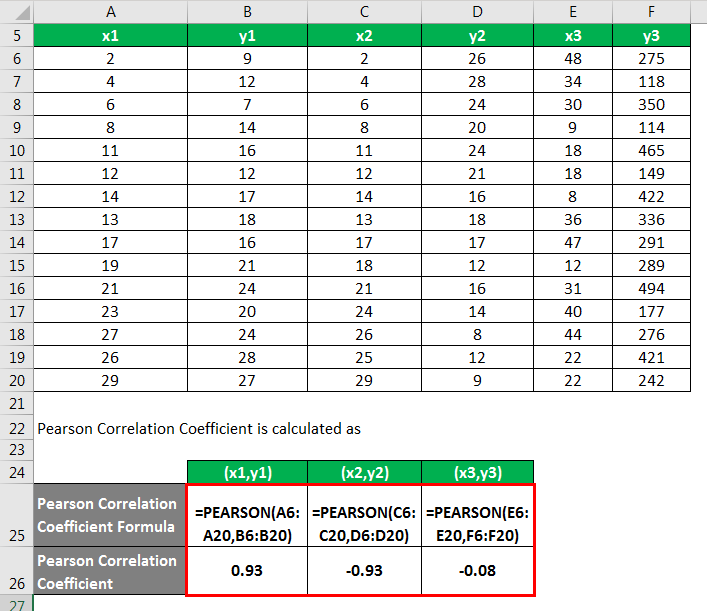
Following are observations of the above case :
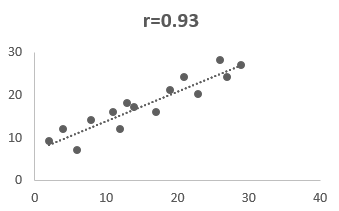
The diagram, which has a value r = 0.93, represents that both the variables are highly positively correlated, which means if there is a positive increase in one variable, the other one will also increase.
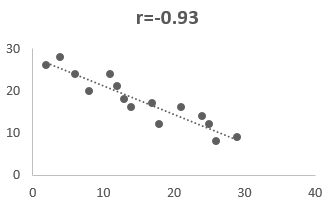
The diagram, which has a value r = -0.93, represents that both the variables are highly negatively correlated, which shows us if there is a positive increase in one variable, the other one will decrease significantly.
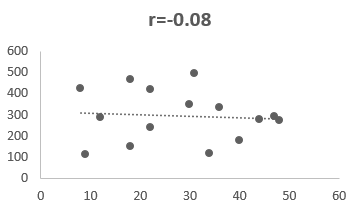
The diagram, which has r = -0.08, represents that there is no relationship between the variables. In short, they both are independent variables.
The conclusion is that the stronger the interrelation between variables when the value of r is near to +1 or -1. In other words, the closer the value of r to 0, the higher the difference between the two variables.
Explanation
The formula for the Pearson Correlation Coefficient can be calculated by using the following steps:
Step 1: Gather the data of the variable and label the variables x and y.
Step 2: Firstly, we need to calculate the mean of both variables and then solve the below equation using the variable data.
Σ(xi – x̄)(yi – ȳ)
Step 3: Next, we need to calculate the Standard Deviation of both variables. Formulae to calculate standard deviation are:
√(Σ(xi – x̄)²) * √(Σ(yi – ȳ)²)
Step 4: To calculate the Pearson Correlation Coefficient, divide the covariance of the variables (derived in Step 1) by the standard deviation of both variables (derived in Step 2).
ρ(x,y) = Σ(xi – x̄)(yi – ȳ) / σx*σy
Relevance and Use of Pearson Correlation Coefficient Formula
Pearson correlation coefficient measures the direction between two linear associated variables. In other words, it determines whether a linear association exists between two continuous variables. Pearson correlation, used widely in multiple sectors like Agriculture, Manufacturing, Health, Medical, etc., helps the analyst understand the strength and the relationships between variables like demand and supply of products, income, and expenditures. It helps us to understand economic behavior. However, you would not need to pursue a Pearson’s correlation unremarkably to see the strength and direction of a linear relationship once you already understand that the connection between your two variables is not linear. It reduces the effect scope of unpredictability; the prediction based on PCC is near to reality.
Pearson Correlation Coefficient Calculator
You can use the following Pearson Correlation Coefficient Formula Calculator.
| (xi - x̄)(yi - ȳ) | |
| σx | |
| σy | |
| Pearson Correlation Coefficient | |
| Pearson Correlation Coefficient = |
| |||||||||
|
Recommended Articles
This is a guide to the Pearson Correlation Coefficient Formula. Here we discuss calculating the Pearson Correlation Coefficient Formula along with practical examples. We also provide a Pearson Correlation Coefficient calculator with a downloadable Excel template. You may also look at the following articles to learn more –
