Updated May 22, 2023
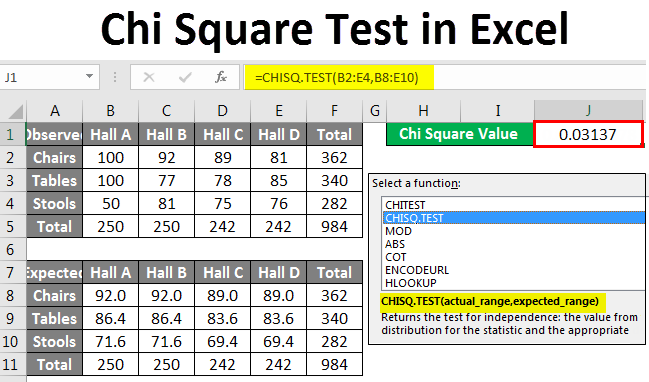
Table of Contents ( Chi-Square Test in Excel )
Chi Square Test in Excel
Chi Square Test in Excel is one such statistical function used to calculate the expected value from a dataset with observed values. Excel is a versatile tool to analyze data visually as well as statistically. It is one of the few spreadsheet tools supporting advanced statistical functions. Using these functions, we can gain insights from a dataset that may not be possible by visually analyzing them. In this article, we will learn how to calculate the Chi-Square from a database using Excel. Before discussing the Chi Square Test, let us go through a few examples.
Chi Square Test is a test of the validity of a hypothesis. The Chi-Square P Value tells us if our observed results are statistically significant or not. A statistically significant result means we reject the null hypothesis (the null hypothesis in statistics is a statement or hypothesis likely to be incorrect). A Chi-Square P-Value is a number between 0 and 1. A Chi-Square P-Value less than 0.05 usually leads to rejecting the null hypothesis.
How to do Chi Square Test in Excel?
Let’s understand how to do the Chi Square Test in Excel with some examples.
Example #1
The chi-Square test can tell us whether the proportion of a given number of items in one place based on a random sample is statistically independent of each other.
Suppose your company has 10000 pieces of furniture. About one by a tenth of them are distributed over four halls. We can find out what proportion of the total furniture is in one hall as shown below:

Observe that we have about 250 pieces of furniture in each hall. If we want to get the expected number of furniture by type, we will calculate it as follows:
Expected value =Category Column Total X (Category Row Total/Total Sample Size)
Using this formula, we get an expected number of about 92 Chairs in Hall A as follows:
Expected Number of Chairs in Hall A = 250 X (362/984)
We will check the difference using the following formula:
((Observed Value-Expected Value)ⁿ)/expected value
In the case of the Chi Square test, n = 2
Which would give us the value 0.713928183. Similarly, we will find the values for each quantity, and the sum of these values is the test statistic. This statistic has an approximate Chi-Squared distribution if each quantity is independent. The following formula would determine the degree of freedom for each quantity:
(number of rows – 1)(number of columns – 1)
Which, in this case, is 6.
We find the Chi-Square P-value for the first value, the number of chairs. The null hypothesis is that the location of the furniture is independent of the type of furniture.
The Chi-Square P-value for the chairs would be calculated as follows:
The sum of all the Chi-Square P values should be 1 if the null hypothesis is true.
We reject the null hypothesis if the test statistic is too large in the present dataset.
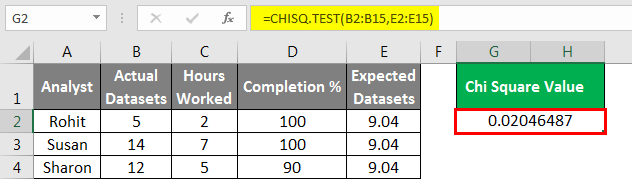
As the above example shows, calculating Chi-Square and testing for the significance of hypothesized data in statistics is a painstaking process and demands high accuracy. The above example can be analyzed using the CHISQ.TEST Function to get the Chi-Square value directly and check if our assumption that the location of the furniture is independent of the type of furniture is correct r not. In this case:
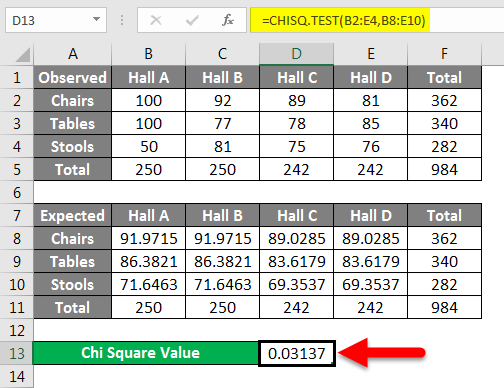
The Chi Square value is approximately 0.03. From our earlier discussion, we now know that this rejects the null hypothesis.
Example #2
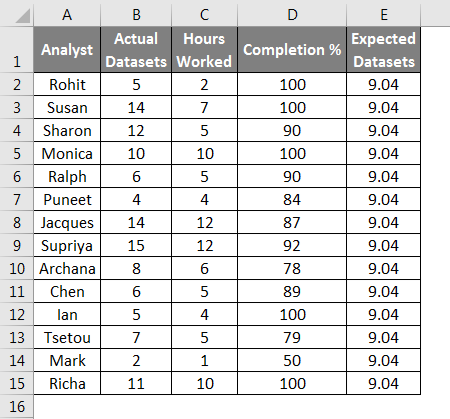
To calculate the p-value in Excel, we need to perform the following steps:
- Calculate your expected value. The anticipated chi-square value is usually a simple average or mean for normally distributed datasets. For more complicated data, please check the example above.
- Type your data into columns and click a blank cell where you want to show the results on the worksheet; click the “Insert Function” button on the toolbar; a pop-up will appear. Type chi in the Search for a Function box and then click “Go” .then select “CHITEST” from the list and then click “OK.”
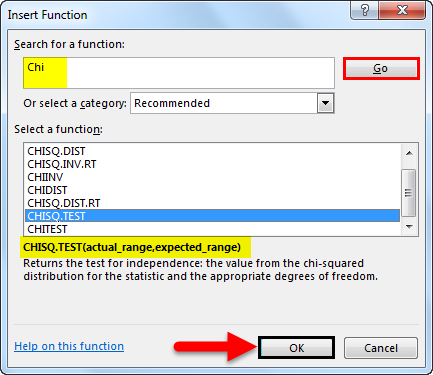
- Select the observed and expected ranges and click “OK.”
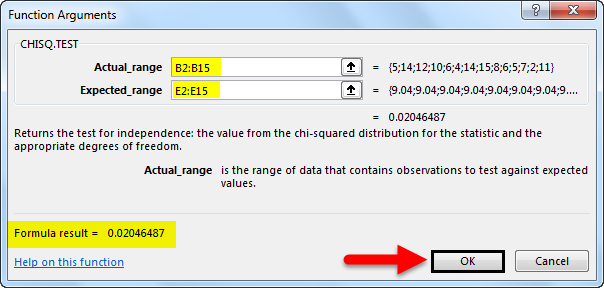
We will get the result as follows.
Things to Remember
- The CHISQ.TEST is not the only Chi Square function available in Excel. All Chi-Square variations are available and can be used depending on your proficiency in statistics.
- The CHISQ functions can also be directly typed into a cell like any other function. This will save time if you know the data ranges you are working with.
- The CHISQ function’s reliability is directly dependent on the structure and distribution of the data and the clarity of the hypotheses being tested. While employing a Chi Square Test to check significance, particular care should be used.
Recommended Articles
This has been a guide to Chi Square Test in Excel. Here we discuss How to do the Chi Square Test in Excel, practical examples, and a downloadable Excel template. You can also go through our other suggested articles –
