Updated August 24, 2023
Dot Plots in Excel (Table of Contents)
Introduction to Dot Plots in Excel
It is said and scientifically proved that; the human brain is better at manipulating and interpreting dots relationships than the lines. Therefore, it is said that dot plots can be easier to understand than conventional bar charts or histograms. A dot plot allows viewing the relationship between two points more precisely than bar charts as well as it is flexible. It can also easily be read, comprising a better user understanding. Though there is no direct inclusion of dot plots under Excel and its different versions, you can still do it under Microsoft Excel with some amendments under conventional bar charts.
What is a Dot Plot?
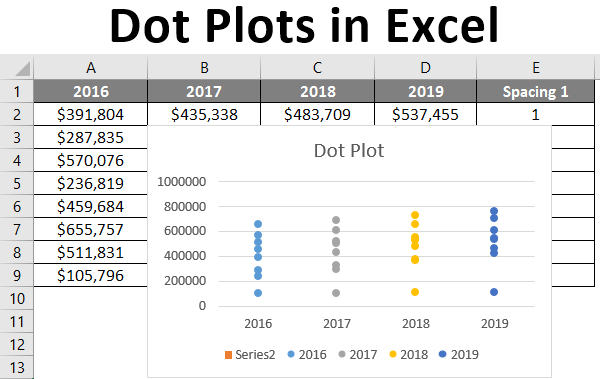
A dot plot is the same as a bar plot; however, the only difference is that the chart will have dots associated with data points contradicting column bars present under the bar chart. This chart plots the data points/series values as dots placed across different categories. These categories are usually plotted on X-axis.
This article will show how to create an Excel dot chart. Though we have conventional scatter plots added under Excel, those can not be considered dot plots.
Example of Dot Plots in Excel
Suppose we have month-wise sales values for four different years, 2016, 2017, 2018, and 2019, respectively. We wanted to draw a dot plot based on this mentioned data.
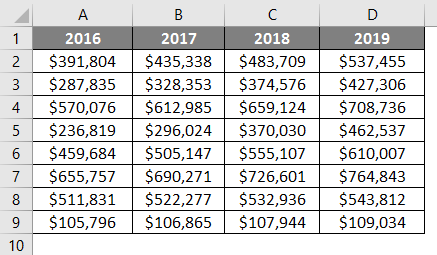
We will first insert a 2-D Column bar chart on the first two rows of this data present. i.e., we will be inserting a graph on cells B1:E2. Follow the below step to insert a column chart based on the first two rows.
Step 1: Navigate to the Insert tab on the Excel ribbon and move toward the Charts section. Click on Insert Column or Bar Chart dropdown bar and select Clustered Column chart under the 2-D Column Chart section.
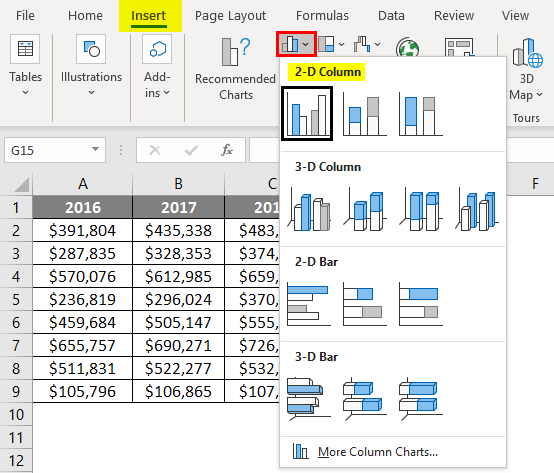
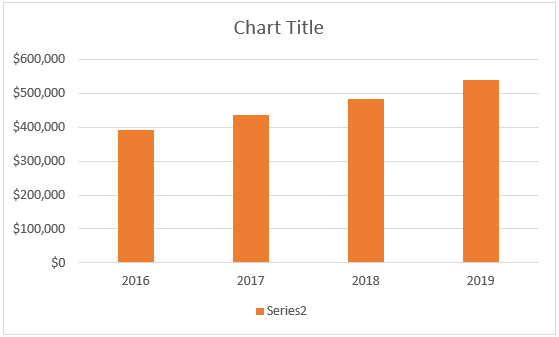
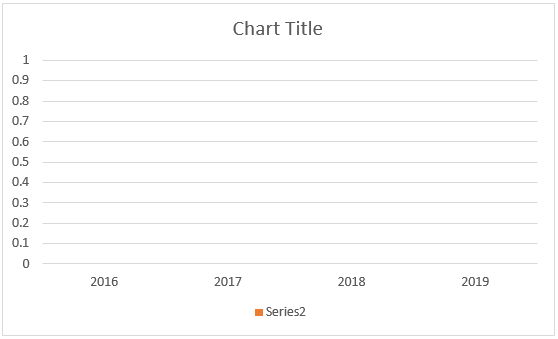
You’ll see a graph, as shown in the screenshot below.
As we wanted to create a chart with dots, removing all these bars for every year’s values is mandatory. We can’t remove the bars series directly; otherwise, our dot chart will get affected. Therefore, we will set the series values for these bars as zero so they are not visible under the chart. Follow the below step to do so.
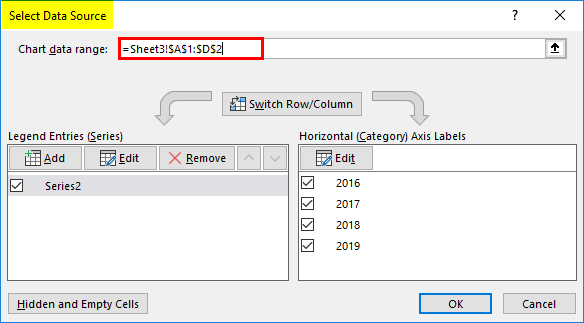
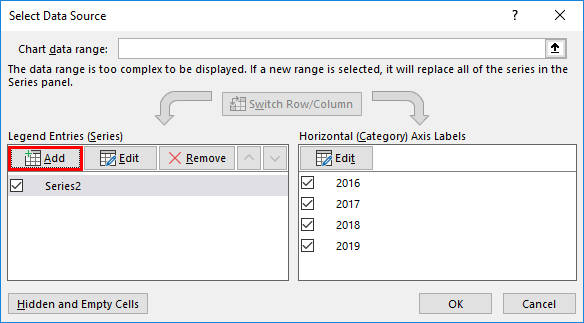
Step 2: Right-click on the chart area and click on the Select Data option. It will open up a Select Data Source window where you can change the data source for Y-axis values, a.k.a. Legend Entries (Series) and X-axis categories, a.k.a. Horizontal (Category) Axis Labels.
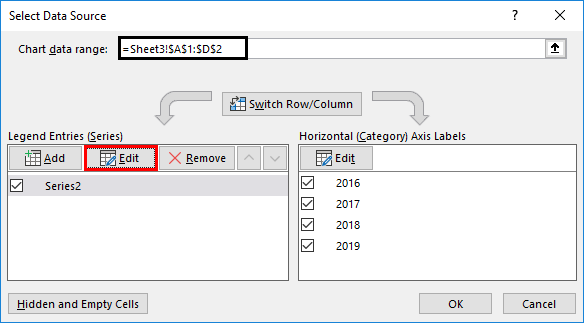
Step 3: Click on the Edit button under the Legend Entries (Series) option; you’ll see all the values we previously selected while creating the chart.
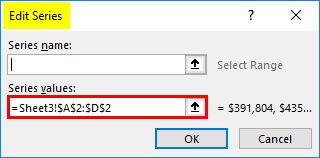
Step 4: Under Series values: option inside Edit Series, change the values to 0,0,0,0 for all four columns. As discussed above, this will negate the column bars appearing on the chart.
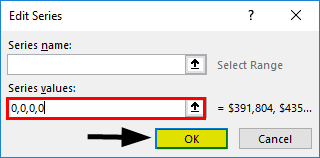
Once you press OK twice after setting the series values to zero, you’ll be able to see no column bars in the chart. See the screenshot below.
Now, we will update this chart into a dot chart with the combination of a column chart & scatter chart. However, we must decide on spacing for four years of data as it is mandatory while creating the dot chart. This spacing is nothing but the distance in units, allowing the dot chart to be separate from each other. I will choose spacings 1, 2, 3, and 4 for four years. This means all the dot charts associated with four years will be at 1 unit distance from each other. This spacing can be changed per your requirement, and it is totally up to you to decide this.
Step 5: Again, click on the Select Data option and click the Add button under Legend Entries (Series) to add some series values.
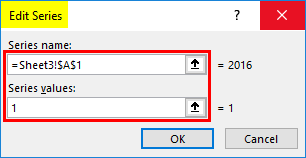
Step 6: Mention the Series name as cell A1 (Where the year 2016 is marked) and the series value as 1 under the Edit Series window.
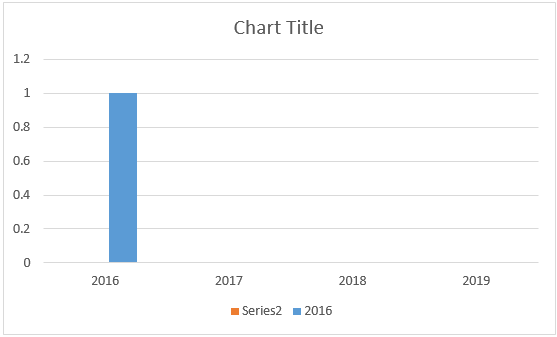
Your graph will look as shown in the screenshot below.
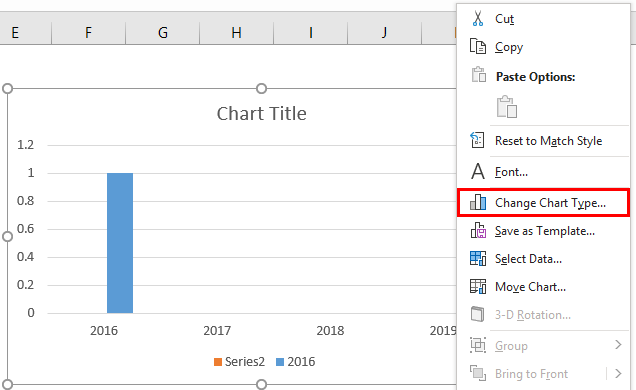
Step 7: Now, we will use the combo of a scatter plot along with a Bar chart. Right-click on the graph area and choose the Change Chart Type option.
Step 8: Select the Combo chart option under the Change Chart Type window and change the chart type as a scatter plot for the series added. See the screenshot below.
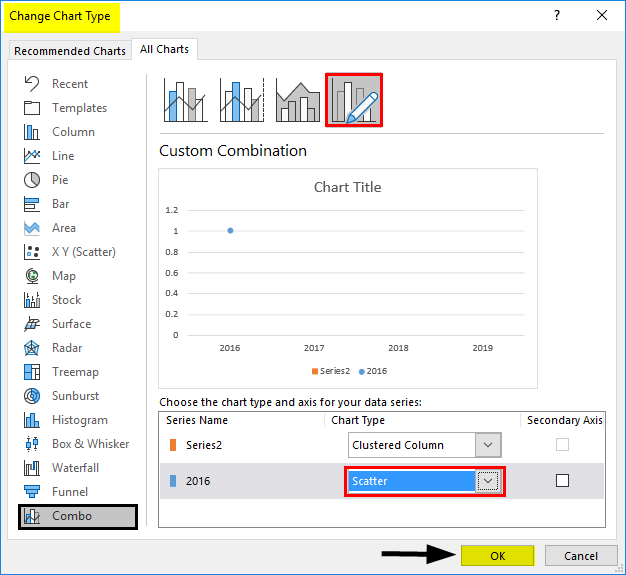
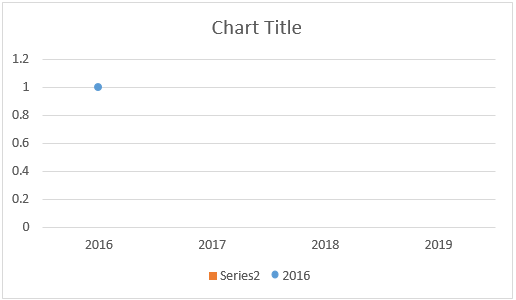
After hitting the OK button, you can see the chart below.
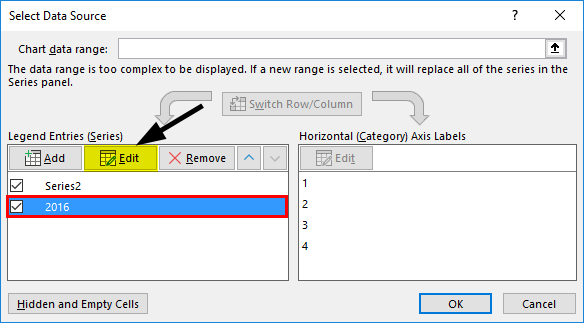
Step 9: Now, you again have to go to Select Data and click on the Edit button for series 2016 under Legend Entries (Series)
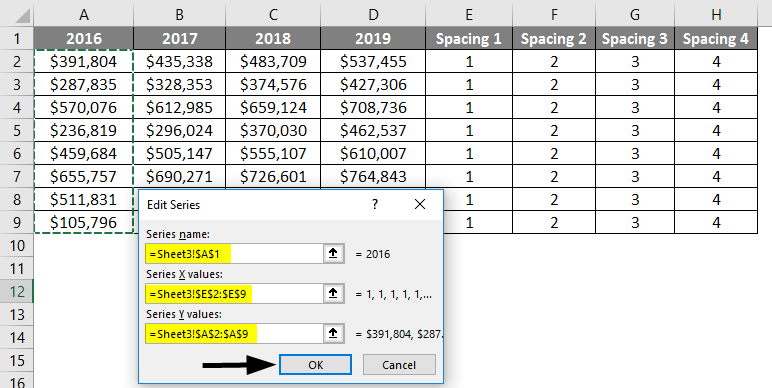
Step 10: Inside the Edit Series window, change the reference of the series name to A1 (2016); the reference for series x values should be the spacing column with the unit as 1 (column E). Concern for series Y values as sales for the year 2016. See the screenshot below for a better understanding.
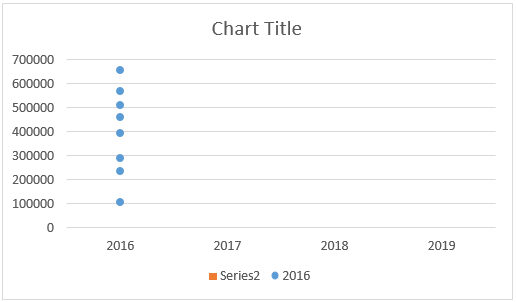
Step 11: Press the OK key two times, and you can see a graph changed to a dot plot, as shown below.
Step 12: Follow the same procedure from Step 9 to Step 11 for 2017, 2018, and 2019 with spacings 2,3 and 4 (columns F, G, and H, respectively) to add the sales values for these years on the chart. After adding the values for this year’s sales, the final chart layout should be like the screenshot below.

Note that I have changed the color of the dot series in the graph. You can choose your custom colors while creating one under the format series or design options.
This is how we can create dot plots in Excel. The article ends here. We will see some points to remember about the Excel dot plot.
Things to Remember
- There is no built-in option for Dot Plot available in any version of Microsoft Excel. However, you can create this graph with the help of a combination of a simple bar chart and a scatter chart.
- Scatter Plot cannot be directly considered a Dot Plot though it has dots within.
Recommended Articles
This is a guide to Dot Plots in Excel. Here we discuss How to create Dot Plots in Excel, practical examples, and a downloadable Excel template. You can also go through our other suggested articles –
