Updated August 10, 2023
Degrees of Freedom Formula (Table of Contents)
What are the Degrees of Freedom Formula?
The statistical indicator “Degrees of Freedom” shows how many variables in a data set can be changed while following certain constraints. The degree of freedom indicates the number of variables we must estimate to complete a data set. It extensively uses probability distributions, hypothesis testing, and regression analysis.
The formula for degrees of freedom for single variable samples, such as a 1-sample t-test with sample size N, can be expressed as sample size minus one. Mathematically, it is represented as,
To calculate the degrees of freedom for two-variable samples, you can express the formula as the product of one less than the number of rows and one less than the number of columns in a Chi-square test with R and C columns. Mathematically, we represent it as such.
Example of Degrees of Freedom Formula (With Excel Template)
Let’s take an example to understand the calculation of Degrees of Freedom in a better manner.
Degrees of Freedom Formula – Example #1
Let us take the example of a sample (data set) with 8 values with the condition that the data set’s mean should be 20. Then the degree of freedom of the sample can be derived as,
Degrees of Freedom is calculated using the formula given below
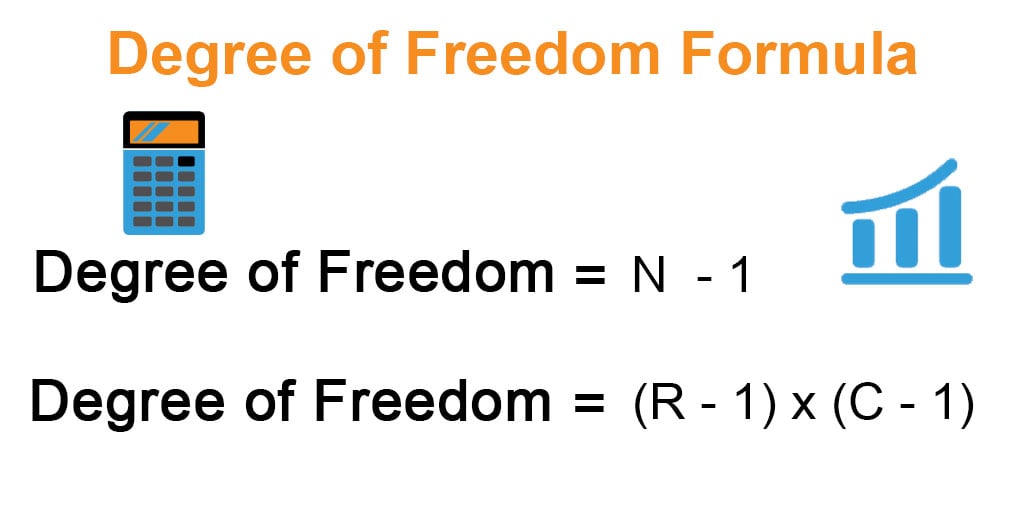
Degree of Freedom = N – 1
- Degrees of Freedom = 8 – 1
- Degrees of Freedom = 7
Explanation: If the following values for the data set are selected randomly, 8, 25, 35, 17, 15, 22, 9, then the last value of the data set can be nothing other than = 20 * 8 – (8 + 25 + 35 + 17 + 15 + 22 + 9) = 29
- On the other hand, if the randomly selected values for the data set, -26, -1, 6, -4, 34, 3, 17, then the last value of the data set will be = 20 * 8 – (-26 + (-1) + 6 + (-4) + 34 + 2 + 17) = 132
- The above examples explain how the last value of the data set is constrained, and as such, the degree of freedom is sample size minus one.
Degrees of Freedom Formula – Example #2
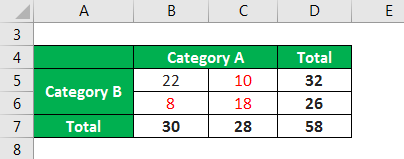
Let us take the example of a simple chi-square test (two-way table) with a 2×2 table with a respective sum for each row and column. Calculate its degree of freedom.
Solution:
In the above, it can be seen that there is only one independent value in black that needs to be estimated. Once that value is estimated, the remaining three values can be easily derived based on the constraints. Therefore,
Degrees of Freedom is calculated using the formula given below
Degree of Freedom = (R – 1) * (C – 1)
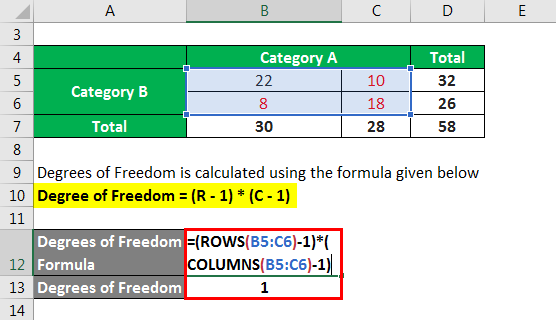
- Degree of Freedom = (2 – 1) * (2 – 1)
- Degree of Freedom = 1
Degrees of Freedom Formula – Example #3
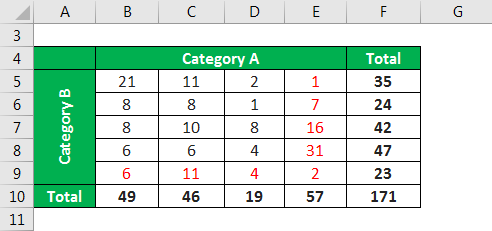
Take the example of a chi-square test (two-way table) with 5 rows and 4 columns with the respective sum for each row and column. Calculate the degree of freedom for the chi-square test table.
Solution:
Degrees of Freedom is calculated using the formula given below
Degree of Freedom = (R – 1) * (C – 1)
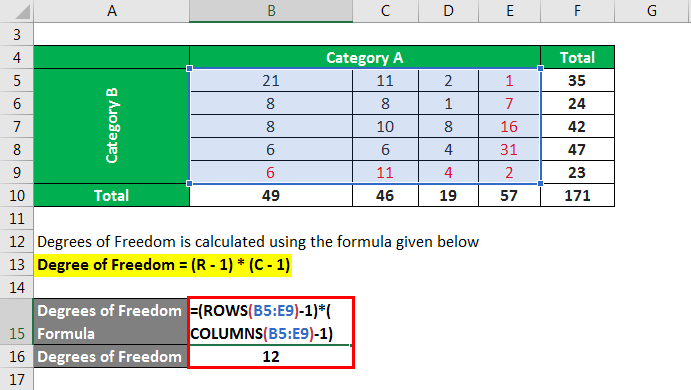
- Degrees of Freedom = (5 – 1) * (4 – 1)
- Degrees of Freedom = 12
In this case, it can be seen that the values in black are independent and, as such, have to be estimated. However, the values in red are derived based on the estimated number and the constraint for each row and column. Therefore, the number of values in black is equivalent to the degree of freedom, i.e., = 12
Explanation
The formula for Degrees of Freedom can be calculated by using the following steps:
Step 1: First, define the constraint or condition to be satisfied by the data set, e.g., mean.
Step 2: Next, select the values of the data set conforming to the set condition. Now, you can select all the data except one, which should be calculated based on all the other selected data and the mean. Therefore, if the number of values in the data set is N, the formula for the degree of freedom is shown below.
Degree of Freedom = N – 1
The formula for Degrees of Freedom for the Two-Variable can be calculated by using the following steps:
Step 1: Once the condition is set for one row, select all the data except one, which should be calculated abiding by the condition. Therefore, if the number of values in the row is R, then the number of independent values is (R – 1).
Step 2: Similarly, if the number of values in the column is C, then the number of independent values in the column is (C – 1).
Step 3: Finally, the formula for the degree of freedom can be derived by multiplying the number of independent values in rows and columns, as shown below.
Degree of Freedom = (R – 1) * (C – 1)
Relevance and Use of Degrees of Freedom Formula
The degree of freedom is crucial in various statistical applications, such as defining the probability distributions for the test statistics of various hypothesis tests. For example, the degree of freedom determines the shape of the probability distribution for hypothesis testing using t-distribution, F-distribution, and chi-square distribution.
Recommended Articles
This is a guide to the Degrees of Freedom Formula. Here we discuss calculating the Degrees of Freedom Formula along with practical examples. We also provide a downloadable Excel template. You may also look at the following articles to learn more –
