Updated August 10, 2023
Confidence Interval Formula (Table of Contents)
What is the Confidence Interval Formula?
In statistics, the term “Confidence Interval” refers to the range of values within which the true population value would lie in the case of a sample out of the population.
In other words, the confidence interval represents the uncertainty expected while determining a true population’s sample population estimate or mean. The use of confidence intervals estimates the sample population as more manageable.
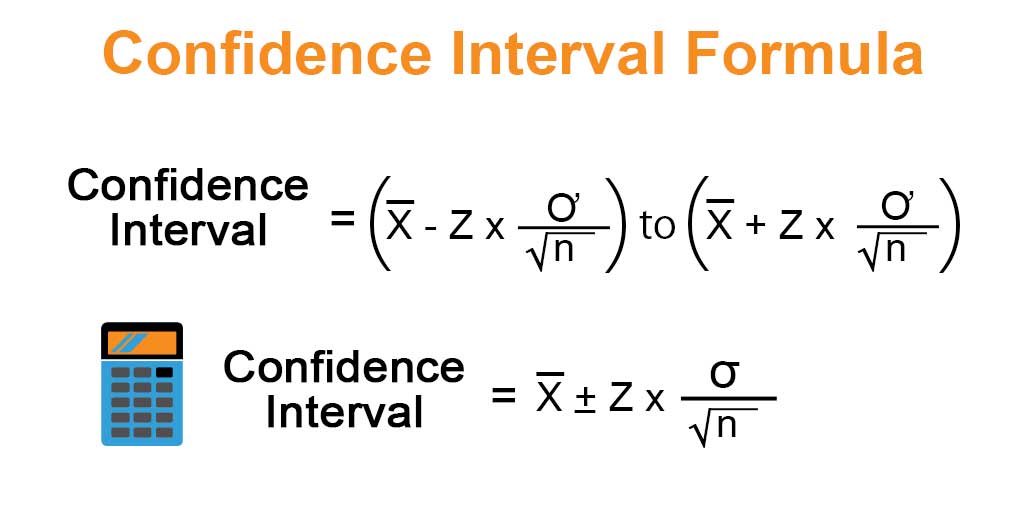
The formula for calculating the confidence interval is subtracting and adding the margin of error from and to the sample mean. The margin of error is computed based on the given confidence level, population standard deviation, and the number of observations in the sample. Mathematically, the formula for the confidence interval is as follows,
OR
Where,
- x̄: Sample Mean
- z: Confidence Coefficient
- ơ: Population Standard Deviation
- n: Sample Size
Example of Confidence Interval Formula (With Excel Template)
Let’s take an example to understand the calculation of the Confidence Interval Formula in a better manner.
Confidence Interval Formula – Example #1
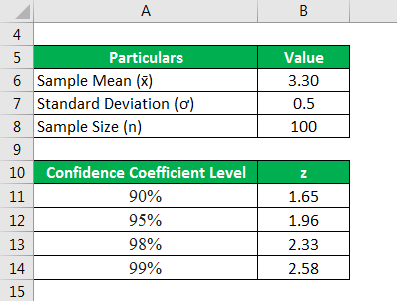
Let us consider the below example of 100 respondents surveyed for their customer service feedback. The survey was on a scale of 1 to 5, with 5 being the best, and the average feedback of the respondents was 3.3, with a population standard deviation of 0.5. Determine the confidence interval for the following data-
- 90% Confidence Level
- 95% Confidence Level
- 98% Confidence Level
- 99% Confidence Level
Solution:
The confidence Interval is calculated using the following formula.
Confidence Interval = ( x̄ – z * ơ / √n) to ( x̄ + z * ơ / √n)
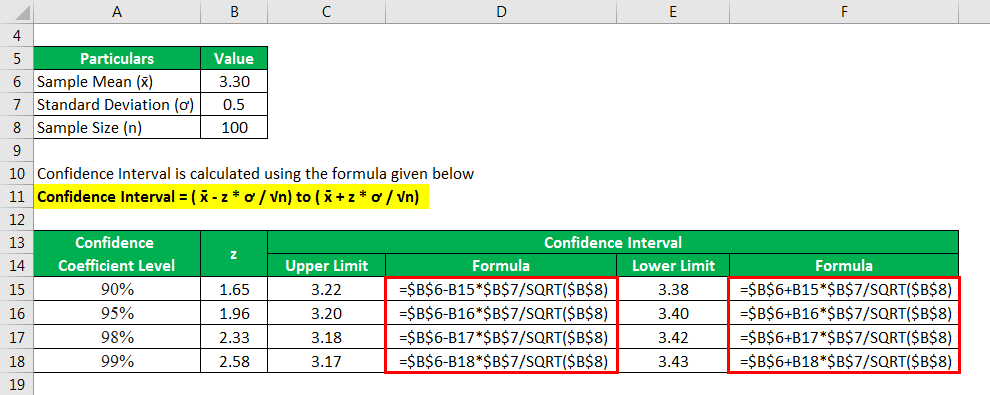
The overall calculation for the Upper Limit and Lower Limit is given below.
For 90%
- Confidence Interval = (3.30 – 1.645 * 0.5 / √100) to (3.30 + 1.645 * 0.5 / √100)
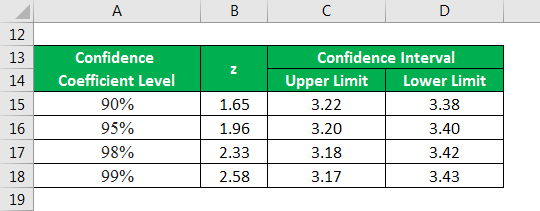
- Confidence Interval = 3.22 to 3.38
Therefore, the Confidence Interval at a 90% confidence level is 3.22 to 3.38.
For 95%
- Confidence Interval = (3.30 – 1.96 * 0.5 / √100) to (3.30 + 1.96 * 0.5 / √100)
- Confidence Interval = 3.20 to 3.40
Thus, the Confidence Interval at a 95% confidence level is 3.20 to 3.40.
For 98%
- Confidence Interval = (3.30 – 2.33 * 0.5 / √100) to (3.30 + 2.33 * 0.5 / √100)
- Confidence Interval = 3.18 to 3.42
Thus, the confidence interval at 98% confidence level is 3.18 to 3.42.
For 99%
- Confidence Interval = (3.30 – 2.58 * 0.5 / √100) to (3.30 + 2.58 * 0.5 / √100)
- Confidence Interval = 3.17 to 3.43
Lastly, the confidence interval at a 99% confidence level is 3.17 to 3.43.
From the above illustration, the confidence interval of a sample spreads out with the increase in confidence level.
Explanation
The formula for the Confidence Interval can be calculated by using the following steps:
Step 1: Firstly, determine the sample mean based on the sample observations from the population data set. It is denoted by x̄.
Step 2: Second, determine the sample size, that is, the number of observations in the sample. It is denoted by n.
Step 3: Third, determine the population standard deviation based on sample observations, mean, and sample size. It is denoted by ơ.
Step 4: Next, determine the confidence coefficient or z-score based on the desired confidence level.
Step 5: Finally, compute the margin of error by using sample size (step 2), population standard deviation (step 3), and confidence coefficient (step 4).
Margin of Error = z * ơ / √n
Step 6: At last, the formula can be calculated by subtracting and adding the margin of error (step 5) from and to the sample mean (step 1) as shown below:
Confidence Interval = ( x̄ – z * ơ / √n) to ( x̄ + z * ơ / √n)
OR
Confidence Interval = x̄ ± z * ơ / √n
Confidence Interval Formula Calculator
You can use the following Confidence Interval Formula Calculator
| x̄ | |
| z | |
| ơ | |
| n | |
| Confidence Interval | |
| Confidence Interval = | (x̄ - z * ơ / √n) to (x̄ + z * ơ / √n) | |
| (0 - 0 * 0 / √0) to (0 + 0 * 0 / √0) = | 0 |
Relevance and Use of Confidence Interval Formula
It is essential to understand the concept of the confidence interval as it indicates the precision of a sampling method. Furthermore, it reveals how stable is the sample population estimate such that there will be a minimum deviation from the original estimate in case the sampling is repeated again and again. However, there is still some confusion about confidence intervals and levels. Please note that a 95% confidence level doesn’t mean that there is a 95% chance that the population parameter will fall within the given interval. In this case, the 95% confidence level implies the estimation procedure or sampling method is 95% reliable.
Recommended Articles
This article is a guide to the Confidence Interval Formula. Here we discuss calculating the Confidence Interval Formula with practical examples. Further, we also provide a downloadable Excel template for Confidence Interval. You may also look at the following articles to learn more –
