Updated July 25, 2023
What is Degree of Operating Leverage?
The term “degree of operating leverage” refers to the financial ratio that measures the impact of change in sales on the operating income (EBIT).
In other words, this metric helps assess the sensitivity of the operating income to the changes in revenue. Basically, the underlying theory for the degree of operating leverage revolves around the mix of variable and fixed costs in the company’s overall cost structure.
Theoretically, a high degree of operating leverage for a company indicates that its overall cost structure has a large proportion of fixed costs. As such, any change in sales will result in a strong variation in operating profitability. On the other hand, a lower degree of operating leverage means that the company’s profitability is less sensitive to changes in sales due to a higher proportion of variable costs in the overall cost structure.
Formula
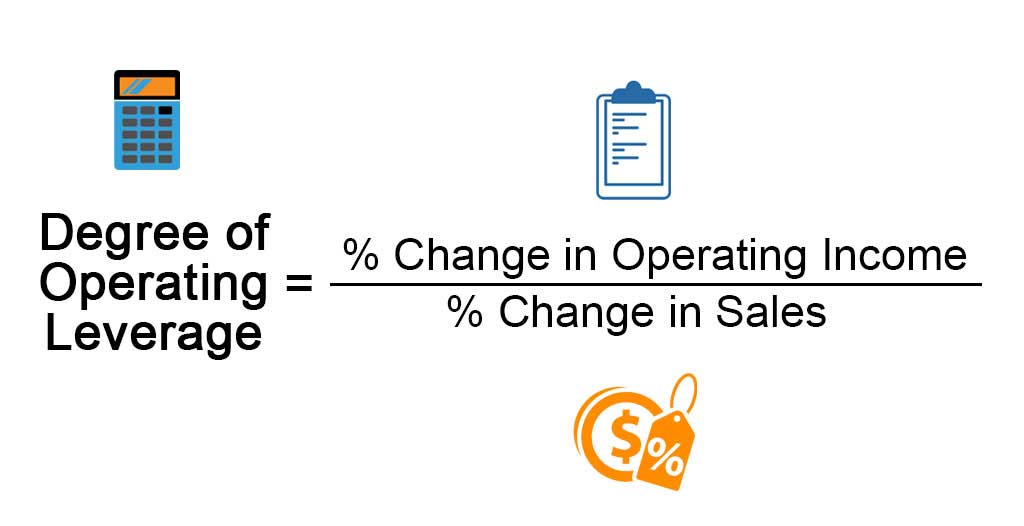
The degree of operating leverage can be derived by dividing the percentage change in operating profit by the percentage change in sales. The mathematical representation of the formula is as below:
Examples of Degree of Operating Leverage (With Excel Template)
Let’s take an example to understand the calculation in a better manner.
Example #1
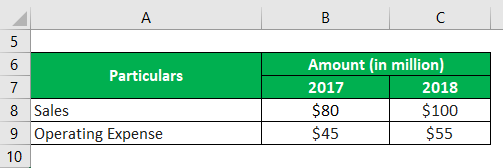
Let us take the example of a company that has achieved total sales of $80 million during the year 2017, while in the year 2018, the company higher revenue of $100 million due to stronger demand for its products. However, the change in the operating expenses was not in line with the revenue growth as the company incurred an operating cost of $45 million in 2017 and $55 million in 2018. Determine the degree of operating leverage of the company based on the given information.
Solution:
For 2017
The formula to calculate Operating Income is as below:
Operating Income 2017 = Sales 2017 – Operating Expense 2017
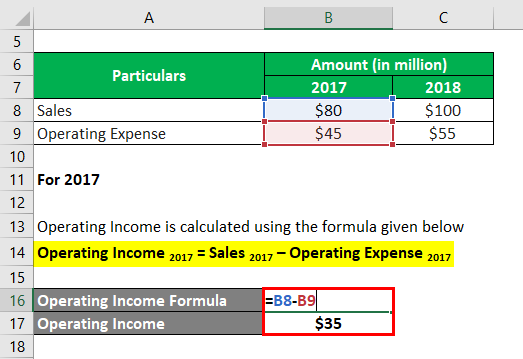
- Operating Income = $80 million – $45 million
- Operating Income = $35 million
For 2018
The formula to calculate Operating Income is as below:
Operating Income 2018 = Sales 2018 – Operating Expense 2018
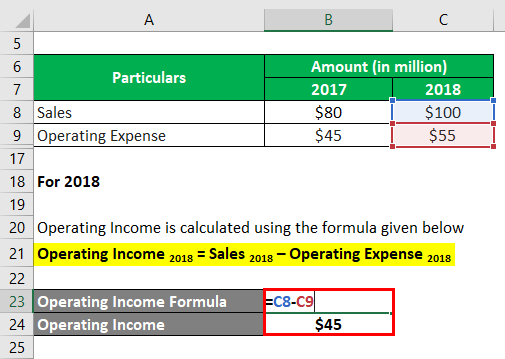
- Operating Income = $100 million – $55 million
- Operating Income = $45 million
The formula to calculate the % Change in Operating Income is as below:
% Change in Operating Income= (Operating Income 2018 – Operating Income 2017) / Operating Income 2017 * 100
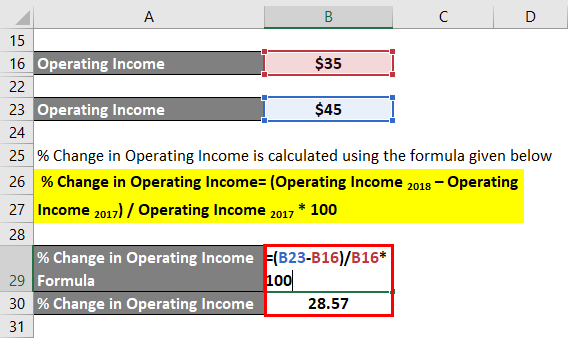
- % Change in Operating Income = ($45 million – $35 million) / $35 million * 100%
- % Change in Operating Income = 28.57%
The formula to calculate % Change in Sales is as below:
% Change in Sales = (Sales 2018 – Sales 2017) / Sales 2017 * 100
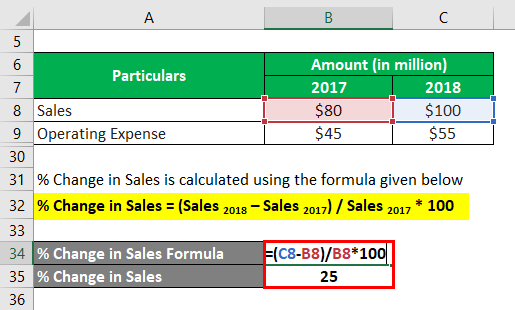
- % Change in Sales = ($100 million – $80 million) / $80 million * 100
- % Change in Sales = 25%
Degree of Operating Leverage = % Change in Operating Income / % Change in Sales
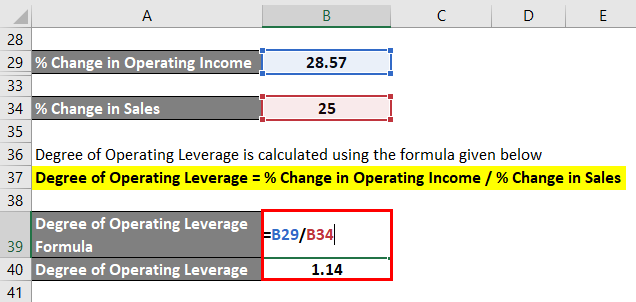
- Degree of Operating Leverage = 28.57% / 25.00% = 1.14
Therefore, based on the given information, it can be seen that the company’s degree of operating leverage is 1.14.
Example #2
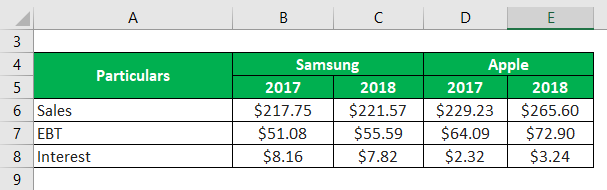
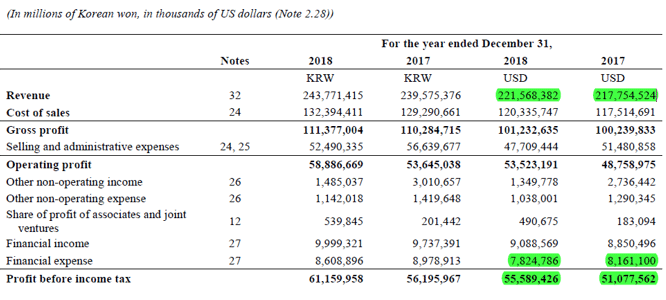
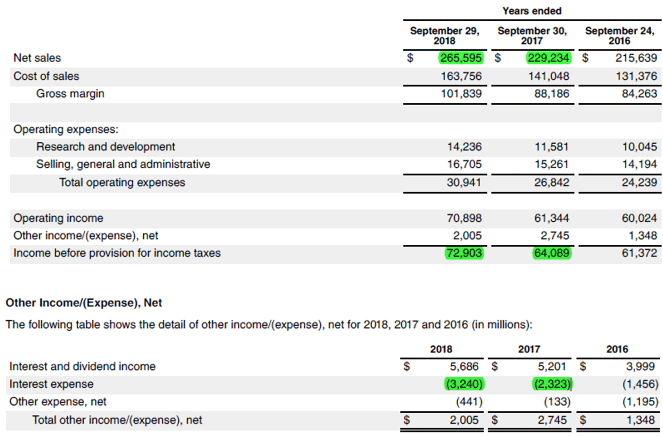
Let us take the example of two real-life companies – Samsung and Apple- to compute and check which cell phone giants have higher operating leverage. According to the annual reports of both companies the following information is available:
Solution:
The formula to calculate Operating Income for 2017 is as below:
Operating Income 2017 = EBT 2017 + Interest 2017
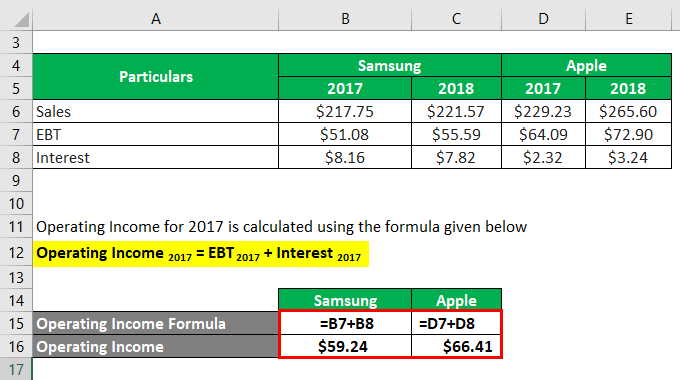
Samsung
- Operating Income = $51.08 billion + $8.16 billion
- Operating Income = $59.24 billion
Apple
- Operating Income = $64.09 billion + $2.32 billion
- Operating Income = $66.41 billion
The formula to calculate Operating Income for 2018 is as below:
Operating Income 2018 = EBT 2018 + Interest 2018
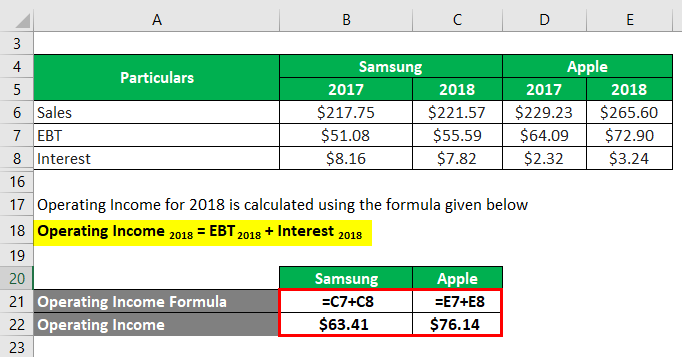
Samsung
- Operating Income = $55.59 billion + $7.82 billion
- Operating Income = $63.41 billion
Apple
- Operating Income = $72.90 billion + $3.24 billion
- Operating Income = $76.14 billion
The formula to calculate the % Change in Operating Income is as below:
% Change in Operating Income = (Operating Income 2018 – Operating Income 2017) / Operating Income 2017 * 100
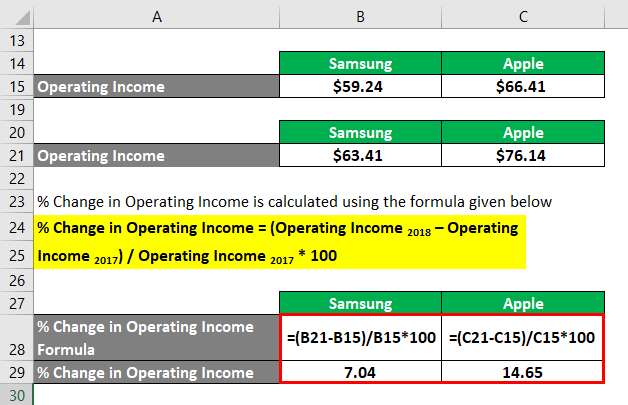
Samsung
- % Change in Operating Income = ($63.41 billion – $59.24 billion) / $59.24 billion * 100%
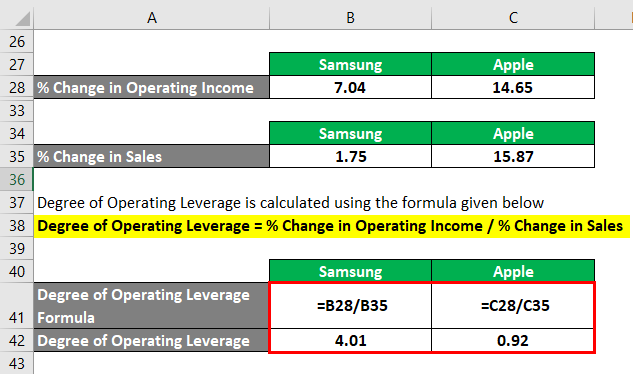
- % Change in Operating Income = 7.04%
Apple
- % Change in Operating Income = ($76.14 billion – $66.41 billion) / $66.41 billion * 100%
- % Change in Operating Income = 14.65%
The formula to calculate % Change in Sales is as below:
% Change in Sales = (Sales 2018 – Sales 2017) / Sales 2017 * 100
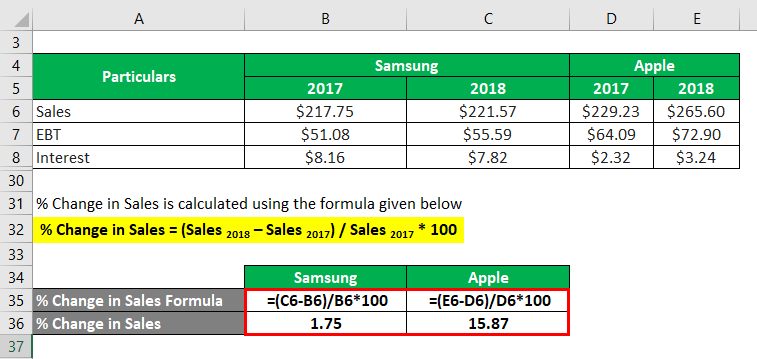
Samsung
- % Change in Sales = ($221.57 billion – $217.75 billion) / $217.75 billion * 100%
- % Change in Sales = 1.75%
Apple
- % Change in Sales = ($265.60 billion – $229.23 billion) / $229.23 billion * 100%
- % Change in Sales = 15.87%
Degree of Operating Leverage = % Change in Operating Income / % Change in Sales
Samsung
- Degree of Operating Leverage = 7.04% / 1.75% = 4.01
Apple
- Degree of Operating Leverage = 14.65% / 15.87% = 0.92
Therefore, Samsung’s % of operating leverage stood at 4.01 compared to 0.92 of Apple, meaning a larger proportion of fixed costs in its cost structure.
Source Link: Samsung Balance Sheet
Source Link: Apple Inc. Balance Sheet
Conclusion
So, it can be concluded that the degree of operating leverage helps assess how well a company can leverage its cost structure to drive its operating profitability. Please note that high operating leverage is a huge positive when sales grow. At the same time, it can be detrimental to a company’s profitability with declining revenue.
Recommended Articles
This is a guide to the Degree of Operating Leverage. Here we discuss how to calculate it along with practical examples. We also provide a downloadable Excel template. You may also look at the following articles to learn more –
