Updated May 25, 2023
F-Test Formula (Table of Contents)
What is F-Test Formula?
F-test is a statistical test that helps us find whether two population sets with a normal distribution of their data points have the same standard deviation or variances. But the first and foremost thing to perform F-test is that the data sets should have a normal distribution. We apply this to the F distribution under the null hypothesis. F-test is a crucial part of the Analysis of Variance (ANOVA). We calculate it by taking the ratios of the variances of two different data sets because variances provide information about the dispersion of the data points. Various tests, like regression analysis and the Chow test, also use the F-test.
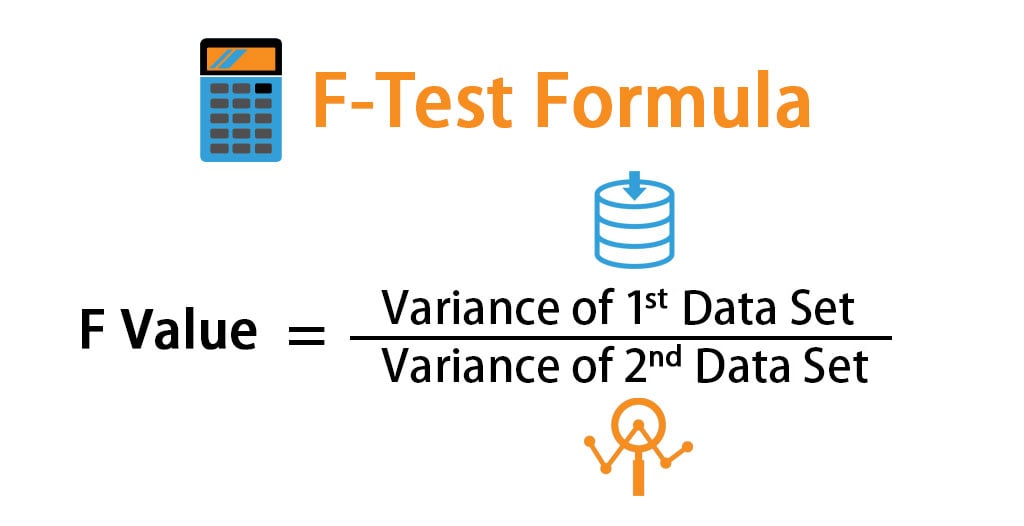
Formula FOR F-Test:
There is no simple formula for F-Test, but it is a series of steps that we need to follow:
Step 1: To perform an F-Test, first, we must define the null and alternative hypotheses. These are given by:-
- H0 (Null Hypothesis): Variance of 1st data set = Variance of a 2nd data set
- Ha: Variance of 1st data set < Variance of 2nd data set (for a lower one-tailed test)
- Ha: Variance of 1st data set > Variance of a 2nd data set (for an upper one-tailed test)
- Ha: Variance of 1st data set ≠ Variance of a 2nd data set (for a two-tailed test)
Step 2: Next thing we have to do is that we need to find out the level of significance and then determine the degrees of freedom of both the numerator and denominator. This helps us determine their critical values. The degree of freedom is sample size -1.
Step 3: F-Test Formula:
Step 4: Find the F critical value from the F table taking a degree of freedom and level of significance.
Step 5: Compare these two values, and if a critical value is smaller than the F value, you can reject the null hypothesis.
Examples of F-Test Formula (With Excel Template)
Let’s take an example to understand the calculation of the F-Test in a better manner.
F-Test Formula – Example #1
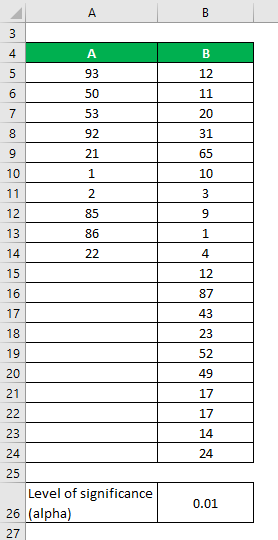
Let’s say we have two data sets, A & B, which contain different data points. Perform F-Test to determine whether we can reject the null hypothesis at a 1% significance level.
Data Sets:
Solution:
Null Hypothesis: Variance of A = Variance of B
The degree of freedom is calculated as
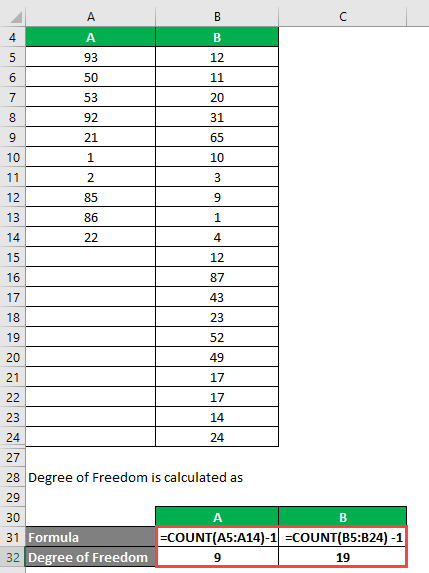
Degree of Freedom
- For A = 10 – 1 = 9
- For B = 20 – 1 =19
Variation is calculated as:
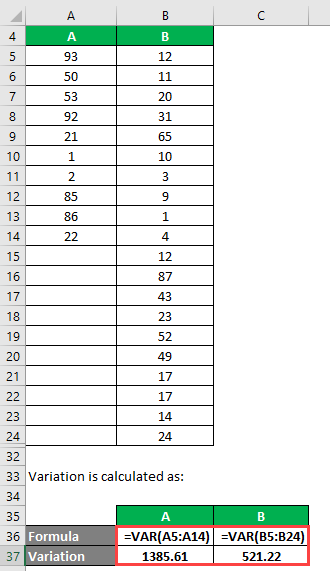
- Variance of A = 1385.61
- Variance of B = 521.22
F Value is calculated using the formula given below
F Value = Variance of 1st Data Set / Variance of 2nd Data Set
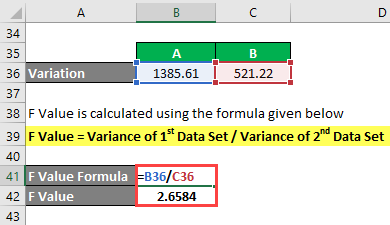
- F Value = 1385.61 / 521.22
- F Value = 2.6584
F-Table:
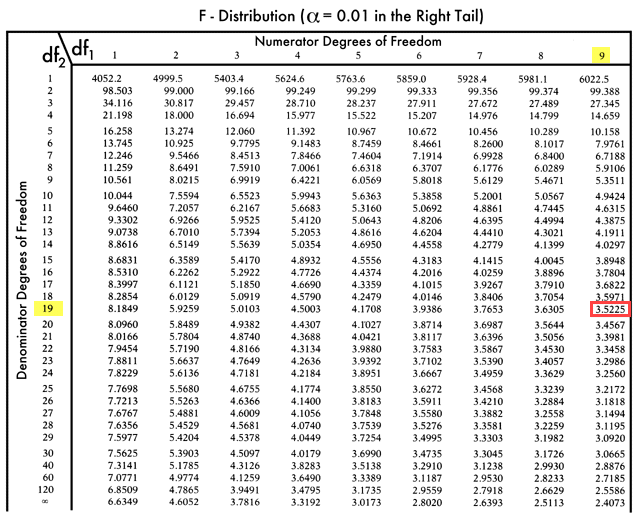
So F critical value = 3.5225
WE CANNOT REJECT THE NULL HYPOTHESIS since F critical is greater than the F value.
F-Test Formula – Example #2
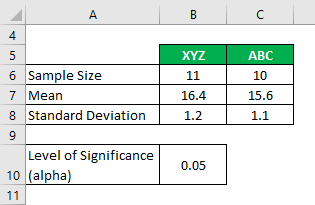
Suppose you are working in a research company and want to know the level of carbon oxide emission from 2 different brands of cigarettes and whether they are significantly different. In your analysis, you have collected the following information:
Solution:
The degree of freedom is calculated as
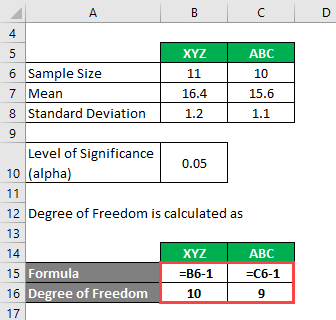
Degree of Freedom
- For XYZ = 11 – 1 = 10
- For ABC = 10 – 1= 9
We calculate variation as follows:
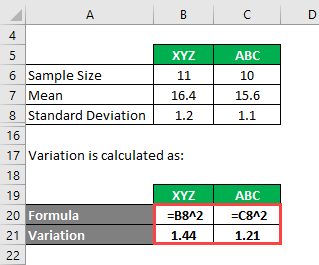
- Variance of XYZ = 1.2^2 = 1.44
- Variance of ABC= 1.1^2 = 1.21
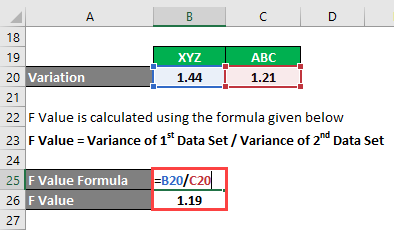
- F Value = 1.44 / 1.21
- F Value = 1.19
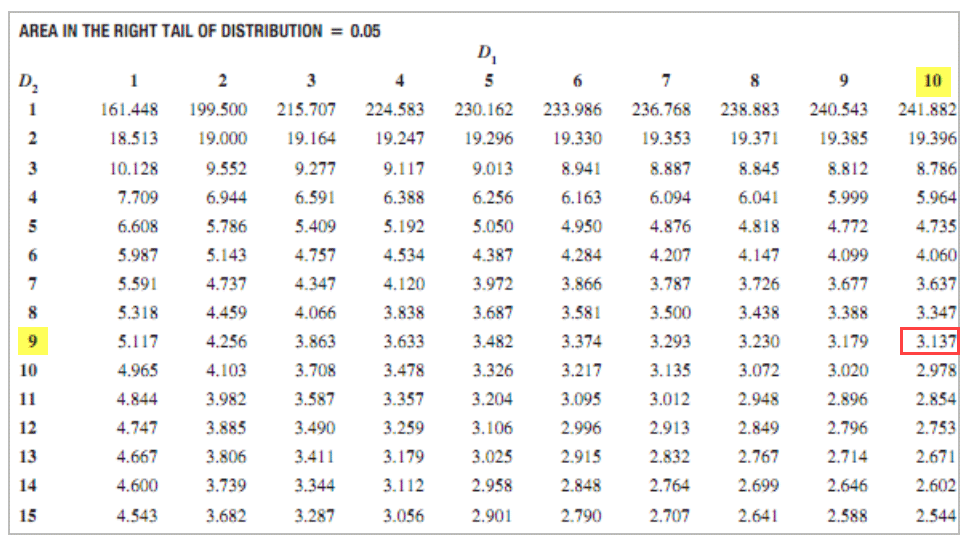
F Critical Value = 3.137
The null hypothesis cannot be rejected since the F critical > F value.
Explanation
In the examples above, we have seen the application of the F-Test and how it is performed. But there is a set of assumptions we need to take care of before performing the F-Test otherwise; we will not get the required results:
- First, we must always place the higher variance value numerator while calculating the F value. So if F = V1 / V2, V1 should be > V2
- If we want to perform 2 tail test, we need to divide the level of significance by 2, and that will be the correct level to find the critical Value.
- We only use Variance in the F value calculation, and if we are given standard deviations, as in example 2, they must be squared to find the Variance.
- Both the samples should be independent of each other, and the sample size should be less than 30
- Population sets from which the samples are drawn out must be normally distributed.
You should consider these key parameters/assumptions while performing the F-Test.
Relevance and Use of F-Test Formula
As discussed above, F-Test helps us check for the equality of the two population variances. So when we have two independent samples drawn from a normal population and want to check whether or not they have the same variability, we use F-test. F-test also has great relevance in regression analysis and testing the significance of R2. So, in a nutshell, F-Test is an essential tool in statistics if we want to compare the variation of 2 or more data sets. But one should keep all the assumptions in mind before performing this test.
Recommended Articles
This has been a guide to F-Test Formula. Here we discuss how to calculate F-Test, practical examples, and a downloadable Excel template. You may also look at the following articles to learn more –
