Updated November 23, 2023
Days in Inventory Formula (Table of Contents)
- Days in Inventory Formula
- Days in Inventory Calculator
- Days in Inventory Formula in Excel (With Excel Template)
Days in Inventory Formula
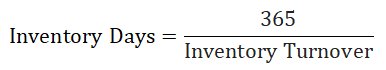
Companies use days in inventory to determine their efficiency in converting inventory into sales. It is calculated by dividing the number of days in the period by the inventory turnover ratio. The numerator of the days in the Formula is always 365, the total number of days in a year.
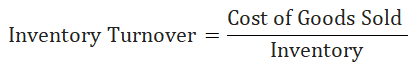
One should look at the inventory turnover formula used in the denominator to understand the days in the inventory formula.
In other words, shorter inventory outstanding indicates the company has the potential to convert the inventory into cash within a short time.
The balance sheet contains the closing inventory or closing stock, while the income statement calculates the cost of goods sold by subtracting the material cost from the revenue.
Thus dividing 365 by the inventory turnover ratio, we can get the Formula of days in inventory.
Examples of Days in Inventory Formula
Let’s take an example to find out the Days in Inventory for a company: –
Days in Inventory Formula – Example #1
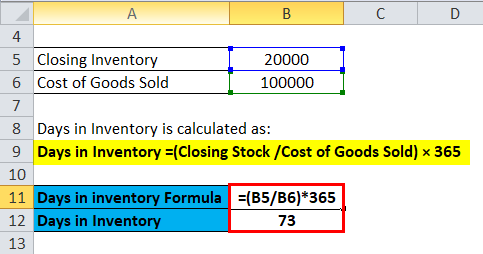
X Ltd. has a closing Inventory in its Balance Sheet at INR 20000, and its Cost of Goods Sold stands at INR 100000. Find Days Sales in inventory.
Days Sales in inventory are Calculated as follows:
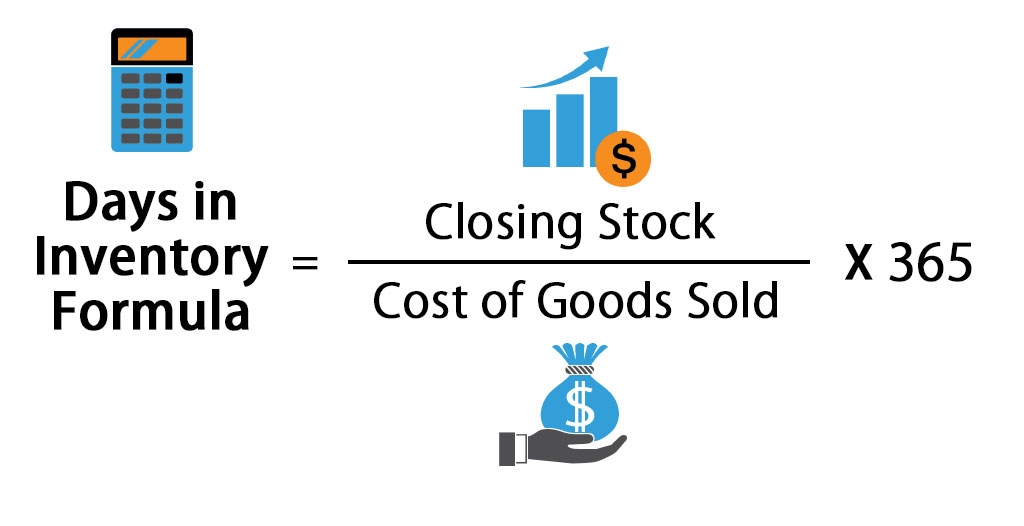
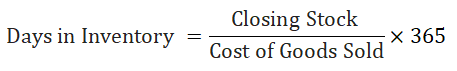
- Days in Inventory =(Closing Stock /Cost of Goods Sold) × 365
- Days Sales in inventory = (INR 20000/ 100000) * 365
- Days Sales in inventory = 0.2 * 365
- Days Sales in inventory= 73 days
This means the existing Inventory of X Ltd will last for the next 73 days, depending on the same sales rate for the following days. Businesses can conduct peer analysis to compare their inventory days with competitors in the same industry. This will help to analyze the product of the company as well as the condition of the business.
Days in Inventory Formula – Example #2
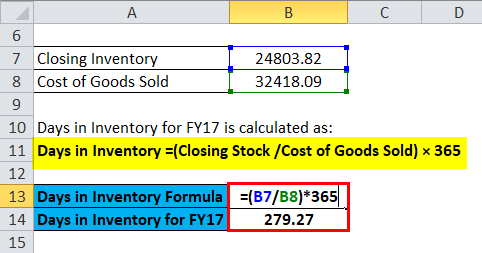
Tata Steel Limited has Closing Inventories for FY18 and FY17 of INR 28,331.04 Cr and INR 24,803.82 Cr, respectively. The company’s Cost of Goods sold stands at INR 41,205.43 Cr and INR 32,418.09 Cr, respectively, for FY18 and FY17. Find which financial year has better Inventory Days.
Days Sales in inventory are Calculated as follows:
- Days in Inventory =(Closing Stock /Cost of Goods Sold) × 365
- Days in Inventory for FY17 = 24,803.82/ 32,418.09 * 365
- Days in Inventory for FY17 = 0.7651 * 365
- Days in Inventory for FY17 = 279.26 days
Days Sales in inventory are Calculated as follows:
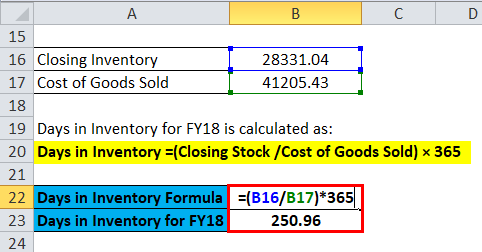
- Days in Inventory =(Closing Stock /Cost of Goods Sold) × 365
- Days in Inventory for FY18 = 28,331.04 / 41,205.43 * 365
- Days in Inventory for FY18 = 0.6875 * 365
- Days in Inventory for FY18 = 250.96 days.
Thus, we get an assumption of the business conditions that the churning of inventory to cash has reduced from 279.26 Days to 250.96 days. The company has reduced the closing stock of its inventory, and there might be a downgrade of the order book for the current financial year, which is why the company is holding lower inventory.
Days in Inventory Formula – Example #3
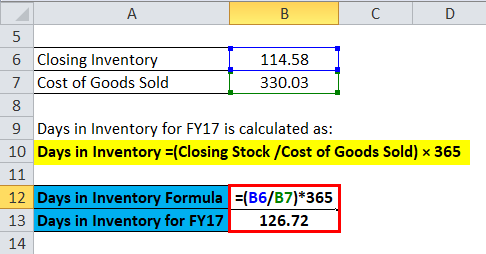
Nocil Limited has Closing Inventories for FY18 and FY17 of INR 155.27 Cr and INR 114.58 Cr, respectively. The company’s Cost of Goods was sold at INR 444.19 Cr and INR 330.03 Cr, respectively, for FY18 and FY17. Find which financial year has better Inventory Days.
Days Sales in inventory are Calculated as follows:
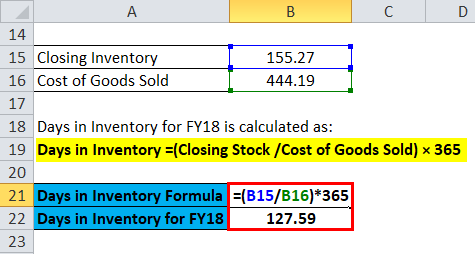
- Days in Inventory =(Closing Stock /Cost of Goods Sold) × 365
- Days in Inventory for FY18 = 155.27/ 444.19 * 365
- Days in Inventory for FY18 = 0.3495 * 365
- Days in Inventory for FY18 = 127.58 days
Days Sales in inventory are Calculated as follows:
- Days in Inventory =(Closing Stock /Cost of Goods Sold) × 365
- Days in Inventory for FY17 = 114.58/330.03 * 365
- Days in Inventory for FY17 = 0.3471 * 365
- Days in Inventory for FY17 = 126.72 days
Thus, from the above calculations, it has been found that the Business scenario is more or less in the same state. The rising inventory level suggests that there has been an increase in demand for the products, but the efficiency of the business has been at the same level.
Explanation
The days in Inventory formula indicates this is one of the vital formulas that gives creditors and investors the ability to measure the value liquidity and the cash flow of the particular company. In finance, we all recognize that we value old inventories less than new ones.
So Days in Inventory formula helps indicate the stock position and its intrinsic value and is very helpful for a manufacturing business. The day’s sales in inventory ratio show the company the present status of its inventory and how long it will last.
We all understand that inventory has high liquidity, which means it can be readily converted into cash when needed, based on the type of stock and its demand.
The quick inventory period indicates a hard-working capital in most cases.
The Formula of days sales inventory is calculated by dividing the closing inventory by the cost of goods sold and multiplying it by 365. Thus management of any company would want to churn its stock as fast as possible to reduce other related expenses and to improve cash flow.
Significance and Use of Days in Inventory Formula
- The metric “days sales in inventory” showcases how quickly a specific business turns over its inventory or, in other words, how efficiently it utilizes the inventory.
- The days in the Inventory formula also indicate the liquidity of the inventory and the position of working capital.
- The day’s sales in the inventory are one of the significant components that decide a particular company’s inventory management. Maintaining inventory incurs costs and requires adherence to specific circumstances based on the business’s product. So, in other words, excess inventory is not suitable for the financial health of a particular business.
- There is an insurance cost attached to every inventory. So, the maintenance cost increases if an inventory stays long. This additional expense is unsuitable for profitability, and there is a chance of inventory obsolescence.
- Higher inventory with low inventory days indicates the business is growing, and the management can increase its inventory management.
- A lower Inventory balance with extended inventory days indicates that the management is facing challenges in selling the products, and the sales team has to be more efficient in the coming days.
- It’s an essential tool for the investors and determines the business efficiency and whether the investors should hold the stock of that particular business. Depending on the Inventory days of the companies in the same group, the investors might give them a call।
Days in Inventory Formula Calculator
You can use the following Days in Inventory Calculator
| Closing Stock | |
| Cost of Goods Sold | |
| Days in Inventory Formula = | |
| Days in Inventory Formula = |
|
||||||||||
|
Days in Inventory Formula in Excel (With Excel Template)
Here, we will do the same example of the Days in Inventory formula in Excel. It is very easy and simple. You need to provide the two inputs, i.e., Closing Stock and Cost of Goods Sold
You can easily calculate the Days in Inventory using the Formula in the template provided.
Days Sales in inventory are Calculated as follows:
Tata Steel calculates days in inventory using the following Formula:
For FY17:
For FY18:
Nocil Limited calculates days in inventory using the following Formula:
For FY17:
For FY18:
Recommended Articles
This has been a guide to a Days in Inventory formula. Here, we discuss its uses along with practical examples. We also provide the Days in Inventory Calculator with a downloadable Excel template. You may also look at the following articles to learn more –
