
Business Intelligence is a term that helps users decide how to run the business or answer important business-related questions. It allows users to manage any organization and grow their business. BI helps users make decisions that grow their business by providing relevant reports and data, which is very important.
So you have finally found your dream job in Business Intelligence, but are wondering how to crack the 2026 Business Intelligence interview and what the probable Business Intelligence Interview Questions could be. Every interview is different, and the job scope is different too. Keeping this in mind, we have designed the most common Business Intelligence interview questions and Answers to help you succeed in your interview. You can easily crack these interview questions.
Top 10 Business Intelligence Interview Questions and Answers
Below are the top Business Intelligence Interview Questions and Answers
Q1. What is Business Intelligence?
Answer:
The term Business Intelligence (BI) provides users with data and tools to answer decision-making questions within an organization; it can be related to running a business or its parts. In short, business intelligence is used to report specified data for any business, which is very important and helps higher management of any organization decide on the growth of their business. Typically, the following decisions can be determined by any organization from the Business Intelligence tool:
- BI is used to determine whether a business is running as planned.
- BI is used to identify which things are going wrong.
- BI is used to take corrective actions and monitor them.
- BI is used to identify the current trends of their business.
Q2. What are the different stages and benefits of Business Intelligence?
Answer:
There are the following five stages of Business Intelligence:
- Data Source: It is about extracting data from multiple data sources.
- Data Analysis: It is about providing a proper analysis report based on practical knowledge gained from data collection.
- Decision-Making Support: It is about using information effectively. It always aims to provide a proper graph on important events like takeovers, market changes, and poor staff performance.
- Situation Awareness: It is about filtering out irrelevant information and setting the remaining information in the context of the business and its environment.
- Risk Management: It is about identifying which corrective actions or decisions to take at different times.
The following are different benefits of Business Intelligence:
- Improving decision-making.
- Speed up decision-making.
- Optimizing internal business processes.
- Increase operational efficiency.
- Helping or driving new revenues.
- We are gaining an advantage over another close competitor in competitive markets.
Q3. What are the different business intelligence tools available in the market?
Answer:
There are a lot of intelligence tools available in the market; below are the most popular:
- Oracle Business Intelligence Enterprise Edition (OBIEE)
- Cognos
- Microstrategy
- SAS Business Intelligence
- Business Object
- Tableau
- Microsoft Business Intelligence Tool
- Oracle Hyperion System
Q4. What is the universe in Business Analytics?
Answer:
The universe is a semantic layer between the database and the user interface. More correctly, it is one of the interfacing layers between the client (business user) and a data warehouse. It defines the relationships among various tables in a data warehouse.
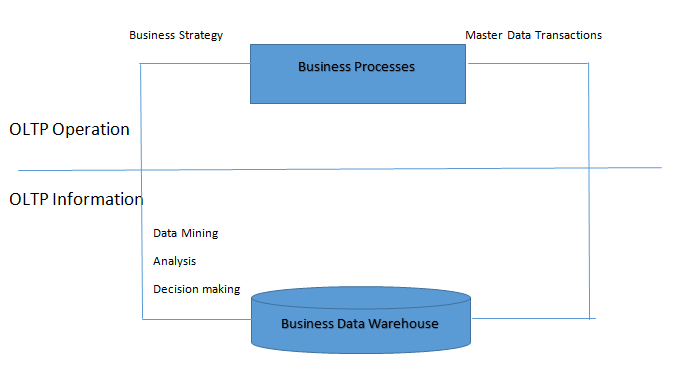
Q5. Define or list the differences between OLAP and OLTP.
Answer:
In general, we can assume that OLTP provides source data for a data warehouse, and OLAP helps analyze it.
| List |
OLTP System |
OLAP System |
| Source of Data | Operational data and OLTP are the original data sources. | Consolidated data, OLAP data, has come from various OLTP databases. |
| Purpose of Data | For any current or fundamental business tasks. | To help with future planning, problem-solving, or decision-making. |
| Data Updating | End users frequently insert or update data in the transactional database. | Data is updated by a batch job at a defined interval. This time can be less than or more than one day. |
| Processing Speed | As usual, typically very fast. | Depends on the amount of data. After refreshing the batch data, complex queries sometimes take more than an hour. A common habit is to add an index to improve the speed. |
| Space Requirement | Again, relatively small considering historical data in the archived state. | Larger as it is, it has to hold all the historical data, and aggregation structures also require more indexes than OLTP. |
| Database Architecture | Normalized data, so all the tables and data have a proper relationship. | Typically, de-normalization of a few tables (like factor dimensions). It usually uses a star or snowflake schema. |
| Backup and Recovery | Backup is an essential requirement on OLTP, as it’s day-to-day data, so any data loss will likely entail significant monetary loss and legal liability. | Instead of regular backups, some environments may opt to reload the OLTP data as a recovery method. |
Q6. What is a dashboard in a data warehouse?
Answer:
The dashboard arranges all the reports and graphs on one page. It is a collection of reports in a different format with the same functionality displayed on the same page.
Q7. Explain the difference between a data warehouse and a transactional system.
Answer:
| Transactional System | Data Warehouse System |
| It is usually designed to process day-to-day data, mainly concentrating on high-volume transaction processing rather than backend reporting. | It is usually designed to process high-volume analytical reporting and subsequent. It is also elaborating on report generation. |
| It is usually process-driven, which depends on a business-specific task or execution. | It is subject-oriented, which means it loads data from a transactional system and then opens it for analytical reporting, helping the organization make informed decisions based on that specific subject. |
| It usually handles current transactional data. | It usually handles historical data. |
| Transactional system data can be inserted, updated, or deleted in each task. | Data warehouse data is called non-volatile, meaning new data can be added regularly, but that data is rarely changed once loaded. |
| For performance or speed, we should always prefer a transactional system for inserting, updating, or deleting small volumes of data. | We should always prefer a data warehouse for retrieving relatively large volumes of data quickly. |
Q8. Explain the Fact and Dimension table with an example.
Answer:
A Fact table is the central table in a data warehouse’s star schema. It was holding quantitative information for analysis, and at the maximum time, it de-normalized.
A dimension table is one of the important tables in a data warehouse’s star schema, which stores attributes, or dimensions, that describe the objects in a fact table.
The fact table mainly holds two types of columns. The foreign key column allows joins with dimension tables, and the significant columns contain the data that is being analyzed.
Example: Suppose one company sells products to customers. So every sale will be one fact, so the fact table holds that information like below:
| Time ID | Product ID | Customer ID | Unit Sold |
| 4 | 17 | 2 | 1 |
| 8 | 21 | 3 | 2 |
| 8 | 4 | 1 | 1 |
Now, in the fact table, there has a customer ID, so we need to maintain one dimension table for a customer like below:
| Customer ID | Name | Gender | Income | Education | Region |
| 1 | SS | M | 2 | 3 | 4 |
| 2 | AC | M | 3 | 5 | 1 |
| 3 | MS | F | 1 | 7 | 3 |
Q9. Define or list the differences between snowflake and star schemas.
Answer:
| List | Snowflake Schemas | Star Schema |
| Maintenance | No redundancy, so easier to maintain. | Holding redundant data makes it less easy to maintain. |
| Complexity | More complex query, hence less easy to understand. | Lower a complex query, so easy to understand. |
| Query Performance | The more foreign keys, the longer the query execution time. | Less a number of foreign keys, so query execution is faster compared to Snowflake. |
| Utilization | Good to use in the data warehouse core to simplify complex relationships (many-to-many). | Good for Data Mart with a simple relationship (1:1 or 1: many). |
| Dimension Table | A snowflake schema may have more than one dimension table for each dimension. | A star schema contains only a single-dimension table for each dimension. |
| De-normalize | A fact table is in de-normalized form, but the dimension table is in normalized form. | The facts and dimensions of both tables are in a de-normalized form. |
Q10. Explain or define a RAGGED hierarchy.
Answer:
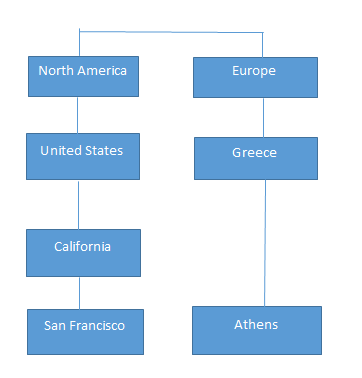
A ragged hierarchy maintains a relationship in case a parent member of at least one member of the dimension is not in the level immediately above the member. For example, if we think about geographical hierarchy and consider North America as a continent, it includes a country (such as the United States), a province or state (such as California), and a city (such as San Francisco). But if we consider Europe, Greece, or Athens, it doesn’t have this kind of hierarchy. So in this example, the branches of Europe, Greece, or Athens descend to different depths, creating a ragged hierarchy.
Q11. What is ETL?
Answer:
ETL stands for Extract, Transform, and Load. It is the process of collecting data from multiple sources, converting it into a consistent format, and loading it into a data warehouse for reporting and analysis.
Example: Extract sales data from ERP systems, transform currencies into a common format, and load the data into a warehouse.
Q12. What is ELT, and how does it differ from ETL?
Answer:
In ELT, data is first extracted from source systems and loaded into a data warehouse, where transformations are performed later. In ETL, data is transformed before loading. ELT is commonly used in cloud-based platforms because it handles large data volumes efficiently and leverages the processing power of modern data warehouses.
ELT stands for Extract, Load, and Transform.
| ETL | ELT |
| Transformation occurs before loading | Transformation occurs after loading |
| Suitable for traditional warehouses | Suitable for cloud platforms |
| Processing happens in ETL tools | Processing happens in the database |
Q13. What is Data Governance?
Answer:
Data Governance is the process of managing an organization’s data through defined policies, standards, roles, and procedures. It ensures that data remains accurate, consistent, secure, and accessible to authorized users. Data governance helps organizations comply with regulations, improve data quality, reduce risks, and support better decision-making by establishing clear rules for how data is collected, stored, used, and maintained.
Benefits:
- Improved data quality
- Better regulatory compliance
- Enhanced security
- Consistent business reporting
Q14. What is a Data Mart?
Answer:
A Data Mart is a smaller, focused section of a data warehouse built for a specific department or business function. It stores relevant data for teams such as sales, finance, marketing, or HR, making reporting and analysis faster and easier. Data Marts help departments access the information they need without querying the entire enterprise data warehouse, improving performance and decision-making.
Example: A sales department may use a Data Mart containing only customer and sales information.
Q15. What are KPIs?
Answer:
Key Performance Indicators (KPIs) are measurable values that help organizations track progress toward specific business goals and objectives. They provide insights into performance, efficiency, and success across different areas such as sales, marketing, finance, and customer service. By monitoring KPIs regularly, businesses can identify trends, measure results, make informed decisions, and take corrective actions to improve overall performance and achieve strategic targets.
Examples:
- Revenue Growth
- Customer Retention Rate
- Net Profit Margin
- Website Conversion Rate
- Organizations use KPIs to monitor progress and make informed decisions.
Q17. What is Self-Service BI?
Answer:
Self-Service Business Intelligence (Self-Service BI) enables business users to access, analyze, and visualize data without relying on IT teams or technical experts. Users can create their own reports, dashboards, and charts using intuitive BI tools. This approach speeds up decision-making, reduces IT workload, and allows departments to gain insights quickly. Examples of Self-Service BI tools include Power BI, Tableau, and Qlik Sense.
Benefits:
- Faster reporting
- Reduced IT dependency
- Improved decision-making
- Greater business agility
Q18. What is a Slowly Changing Dimension (SCD)?
Answer:
A Slowly Changing Dimension (SCD) is a dimension in a data warehouse whose attribute values change over time but not frequently. It helps organizations track and manage historical data changes while maintaining accurate reporting. Common SCD types include Type 1 (overwrite old data), Type 2 (create a new record to preserve history), and Type 3 (store limited historical information). For example, when a customer changes their address, SCD techniques help manage that change effectively.
Common Types:
Type 1: Overwrites old data.
Type 2: Creates a new record while preserving history.
Type 3: Maintains limited historical information in additional columns.
Example: A customer changes their city from Mumbai to Pune.
Q19. What is Data Cleansing?
Answer:
Data Cleansing is the process of detecting and correcting errors, inconsistencies, duplicate records, and missing values in a dataset. It helps improve data quality, accuracy, and reliability for reporting and analysis. Organizations perform data cleansing before using data in business intelligence systems to ensure that decisions are based on correct and consistent information rather than inaccurate or incomplete data.
Benefits:
- Improved data quality
- More accurate reports
- Better business decisions
Q20. What is Metadata?
Answer:
Metadata is often called “data about data” because it provides information that helps describe and understand other data. It includes details such as column names, data types, file size, creation date, and data source. Metadata helps users find, organize, and manage data more easily. In business intelligence and databases, it improves data accuracy, reporting, and analysis by providing clear information about how data is structured and used.
Example: A column named “Order_Date” may have metadata specifying that it stores date values in YYYY-MM-DD format.
Q21. What is Drill-Down Analysis?
Answer:
Drill-down analysis is a method used in Business Intelligence to examine data at different levels of detail. Users start with summarized information and gradually move to more detailed data to understand the reasons behind specific results. For example, if total sales decrease, a manager can drill down from yearly sales to quarterly, monthly, and daily sales records to identify when and where the decline occurred. This process helps organizations find trends, detect problems, and make better business decisions based on detailed insights.
Q22. What is a KPI Dashboard?
Answer:
A KPI Dashboard is a screen that shows the most important business numbers in an easy-to-understand format. It helps managers and teams track performance, measure progress toward goals, and identify areas that need attention. By displaying charts, graphs, and key metrics in one place, it supports faster decision-making. For example, a sales dashboard may show revenue, profit, customer growth, and monthly sales performance.
Q24. What is Real-Time Business Intelligence?
Answer:
Real-Time Business Intelligence (RTBI) gives businesses access to up-to-date data as soon as it is generated. It helps managers and employees monitor operations, track performance, and make quick decisions based on current information. Unlike traditional BI, which uses historical data, RTBI focuses on live data streams to identify trends, opportunities, and problems immediately.
Example: Monitoring live website visitors, online orders, or stock market activity in real time.
Q23. What are the characteristics of a Data Warehouse?
Answer:
It stores data related to specific business areas such as sales, finance, or customers. It combines data from different sources into one place and keeps historical records for analysis. Once data is stored, it is rarely changed or deleted. These features help organizations create reports, identify trends, and make better business decisions.
According to the classic definition, a Data Warehouse is:
- Subject-Oriented
- Integrated
- Time-Variant
- Non-Volatile
Q24. What is a Surrogate Key?
Answer:
A Surrogate Key is a unique number that the system creates automatically for each record in a table. It does not contain any business information and is used only for identification purposes. In data warehouses, surrogate keys help link fact and dimension tables efficiently. They also make it easier to track historical changes because they remain the same even if business data, such as customer details, changes.
Example:
| Customer_Key | Customer_ID |
| 1001 | C101 |
| 1002 | C102 |
Q25. What is a Cube in OLAP?
Answer:
An OLAP Cube is a multidimensional data structure that allows users to analyze large amounts of data quickly from different perspectives. It organizes data into dimensions such as time, product, and region, along with measurable values like sales or profit. OLAP cubes support operations such as drill-down, roll-up, slice, and dice, enabling faster reporting and decision-making.
Dimensions Example:
- Time
- Product
- Region
Q26. What is the difference between a Report and a Dashboard?
Answer:
A report presents detailed information about business activities and is used for thorough analysis. It usually contains tables, data records, and multiple pages. A dashboard displays key metrics, charts, and KPIs on a single screen, providing a quick overview of business performance. Reports help users examine details, while dashboards help managers monitor performance and make decisions quickly.
| Report | Dashboard |
| Detailed information | Summary information |
| Usually static | Often interactive |
| Focuses on specific analysis | Focuses on KPIs and performance |
| Can contain multiple pages | Usually displayed on a single screen |
Recommended Articles
This is a guide to the List of Business Intelligence interview questions and answers, so candidates can crack these Questions easily. You may also look at the following articles to learn more –
