Updated March 20, 2023
Overview of Fact Table
A Fact table in a Data Warehouse system is nothing but the table that contains all the facts or the business information, which can be subjected to analysis and reporting activities when required. These tables hold fields that represent the direct facts, as well as the foreign fields that are used to connect the fact table with other dimension tables in the Data Warehouse system. A Data Warehouse system can have one or more fact tables, depending on the model type used to design the Data Warehouse.
Characteristics of Fact Table
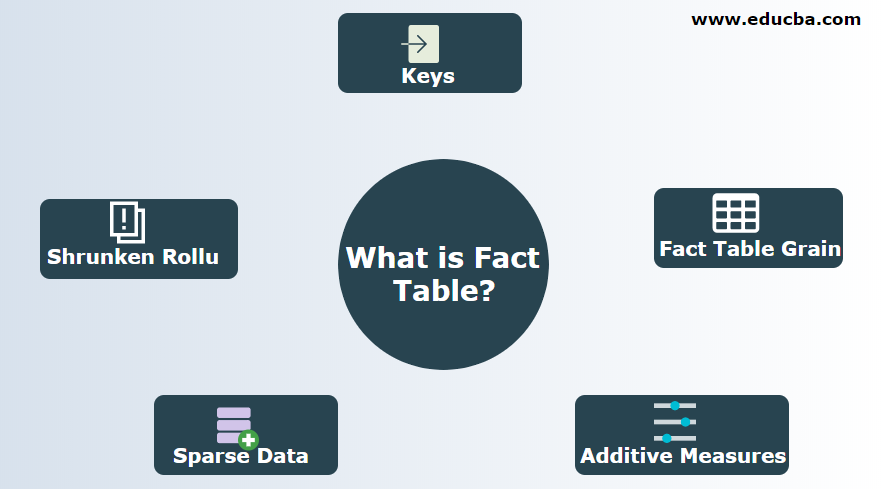
Below are the characteristics of the fact table:
- Keys: It has a key or a primary key which is the accumulation of all the primary keys of all dimension tables linked with it. That key is known as a concatenated key that helps to uniquely identify the row.
- Fact Table Grain: The grain of a table depicts the level of the detail or the depth of the information that is contained in that table. More the level, the more the efficiency of the table.
- Additive Measures: Attributes present in this can be fully additive, non-additive or semi-additive. Fully additive or additive measures are added to all the dimensions. Semi- additive are those measures that are added to some of the dimensions and not to all the dimensions and non-additive measures are stored fundamental units of measurement for a business process.
- Sparse Data: There are records that have attributes containing null values or measures. They provide no information.
- Shrunken Rollup Dimensions: Shrunken Rollup dimensions are the subdivisions of the base dimension.
Types of Fact Table
It is categorized under three fundamental measurement events:
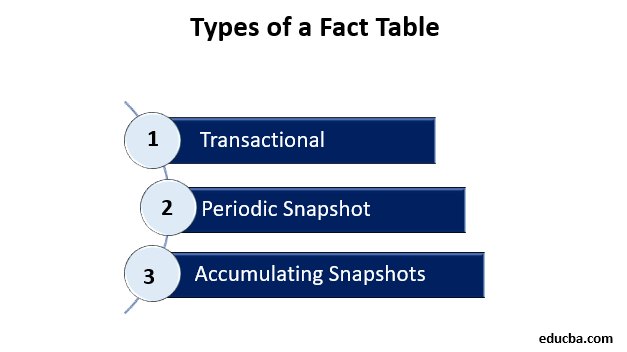
- Transactional
- Periodic Snapshot
- Accumulating Snapshots
Let us understand this based on the measurement in brief.
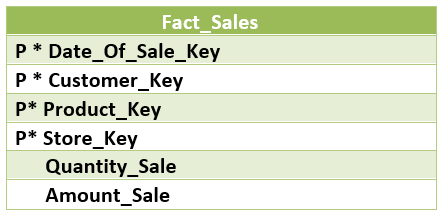
1. Transaction Fact Table
This is a fundamental and basic view of business operations. It is used to represent an occurrence of an event at any instantaneous point in time. The facts measure are valid only for that particular instant and only for that event. The grain which is associated with the transaction table specifies as “one row per line in a transaction”. Usually, it contains the data of the detailed level, which leads it to have a large number of dimensions associated with it. It captures the measurement at the most basic or atomic level of dimension. This helps the table to give robust dimensional grouping, roll up & drill-down reporting capabilities to the users. It is dense and sparse. It can be large, maybe containing billions of records. Let us see an example of sales in a grocery shop.
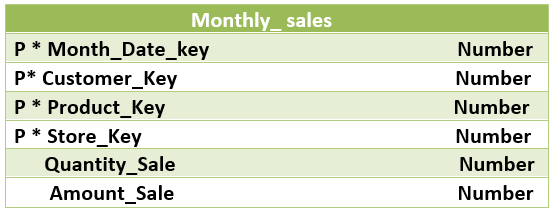
2. Snapshot Fact Table
The snapshot gives the state of things at a particular instance of time or “picture of the moment”. It normally includes more non-additive and semi-additive facts. It helps to review the cumulative performance of the business at regular and predictable intervals of time. In this, the performance of an activity at the end of each day or a week or a month or any other time interval is represented, unlike the transaction fact table where a new row is added for the occurrence of every event. But snapshot fact tables or periodic snapshots are dependent on the transaction fact table to get the detailed data present in the transaction fact table. The periodic snapshot tables are mostly dense and can be large as transaction fact tables. Let us see an example of the periodic snapshot of the sales of the same grocery shop as in the transaction fact table.
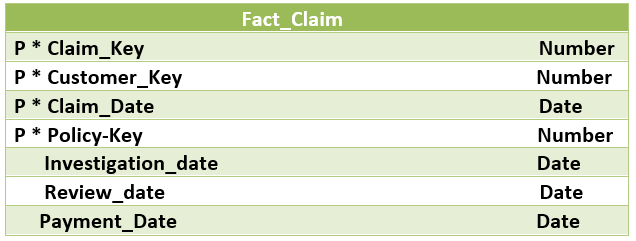
3. Accumulating Fact Tables
These are used to represent the activity of any process that has a well defined and clear starting and end. Accumulating snapshots mostly have multiple data stamps that represent the predictable phases or events that occur during the lifetime. Sometimes there is an extra column containing the date that shows when the row was last updated. Let us see an example.
How does it work in a Data Warehouse?
It basically represents the metrics related to an event. The meaning of any fact table must be represented by the table name or the composition of the primary key of the table. The most important choice to make is to decide the primary key. A surrogate key can also be created to work as a primary key. If a user does not want to use a surrogate key then he may use the composition of foreign keys which points to the combination of dimensions related to the fact. The use of foreign keys gives an idea about the grain or granularity of the table.
Four steps that can be followed to design is described by Kimball:
- Selecting a business process to model.
- Declaring the grain.
- Choosing the dimensions.
- Identifying facts.
Advantages of Fact Table
- It contains quantitative information for analysis.
- It containing performance metrics are usually normalized.
- It can contain different measures like additive, semi-additive and non-additive.
Conclusion
In this article, we discussed its types, working, and advantages. It is a central part of a star or snowflake schema. It is connected to dimension tables to give the structure of a star or a snowflake.
Recommended Article
This has been a guide to What is Fact Table? Here we discuss the characteristics and various types of fact tables along with their Advantages. You may also look at the following articles to learn more –
