Updated July 10, 2023
What is Aggregate Demand (AD)?
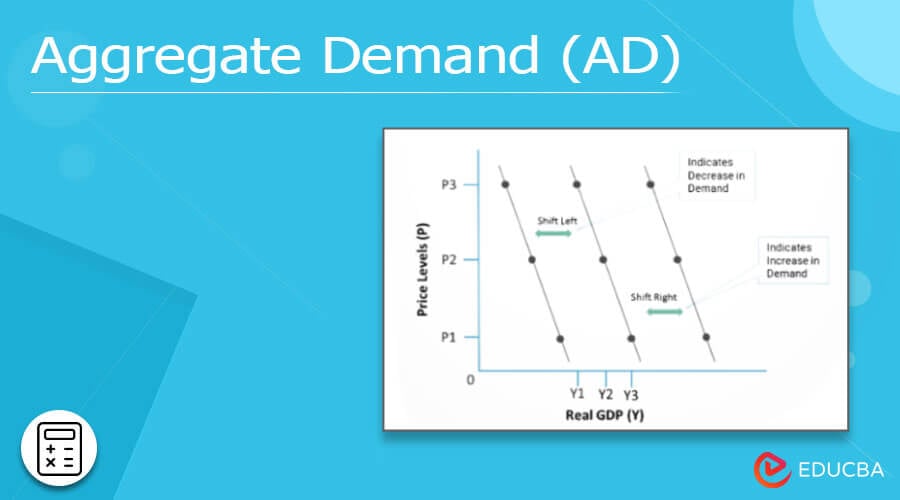
Aggregate Demand (AD) is the total demand in an economy for goods and services at a given time and price level. It is an economic indicator and one of the most important economic variables. Economists use aggregate demand when examining an economy’s strength.
Four components contribute to aggregate demand. They are Consumption (C), Investment (I), Government Expenditure (G), and Net Exports(X-M). (AD) is calculated by using these four components.
Key Takeaways
- Aggregate demand means the overall demand value of a country’s goods and services. It is measured over a specific period and at a particular price level.
- The four components are consumer spending, investment, government spending, and the difference between exports and imports.
- AD changes when any of the inputs(components’ value) change.
- An increase in demand causes the demand curve to shift to the right, while a decrease in demand causes the curve to shift to the left. Variations in factors other than the price of goods or services explain shifts in the demand curve to the right or left.
Components of Aggregate Demand (AD)
It comprises four components. The mathematical formula to calculate is,
The connection between demand and its four components shows in the formula.
Aggregate Demand (AD) = Consumer Spending + Investment Spending + Government Spending + (Exports-Imports)
- Consumer Spending: It is the amount that the country’s consumers have spent in a given time. Consumer spending is the purchase of goods and services by the country’s people. They are all the things that people buy to live comfortably, like transportation, food, clothing, appliances, and others.
- Gross investment (I): The purchase of machinery, software, and buildings, as well as the creation of inventories by businesses, are all investments. They also include capital expenditures incurred by the public sector for acquiring investment goods. These investments are usually made for future profits.
- Government Spending: Governments spend money to improve the general and non-individualized quality of services for society. Services like the military, healthcare, education, and transportation are a few government expenses. Financial management organizations use public revenues like taxes and income from services like food, water, and electricity to pay for these expenses.
- Net exports (X-M): Net exports is the difference between exports(X) and imports(M). Exports are goods and services produced in an economy and sold to the rest of the world. Such exports generate revenue. Imports are goods and services made elsewhere and brought into an economy to meet the needs of its economic agents. We subtract imports from exports as AD is the demand for a country’s domestic goods and services.
Aggregate Demand Curve – Shifts
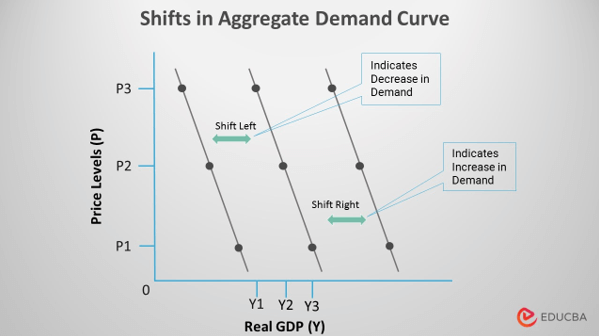
- The AD curve represents the relationship between the GDP of goods and services at specific price levels. The AD curve has a negative slope, an inverse relationship between price and quantity demanded. It indicates that as prices for products increase, the demand decreases.
- Price level changes cause curve movements, whereas shifts occur when some other variable influences the demand. If we hold the overall price level constant, changes in underlying AD determinants shift the location of the existing aggregate demand curve. The AD curve will move either left (inwards) or right (outwards), depending on whether these components increased or decreased.
- A shift to the right on the demand curve indicates increased demand. An increase in revenue, the cost of a substitute, or a decrease in the cost of a supplement are a few factors.
- The aggregate supply curve can move left when something other than an increase in the price level causes the AD to fall. It happens when the components’ value decreases due to several reasons. Some reasons might be the drive for higher savings, rising taxes on investment returns, cuts to defense expenditures, or when a foreign economy enters a recession.
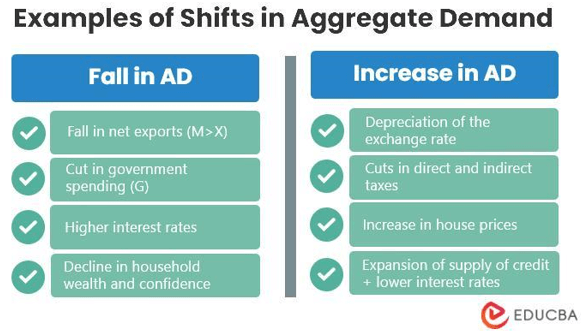
What causes Aggregate Demand (AD) to Increase?
AD can increase due to a change in its components. Several factors can increase AD, including monetary and fiscal policies, wage increases, and citizens’ expectations. All of these are macroeconomic factors with the potential to increase AD.
Monetary policies increase AD because a country’s central bank uses this economic factor to manipulate citizen spending. When the central bank detects a sustained drop in overall demand, it may lower interest rates to encourage more people to spend money.
When interest rates fall, the country’s banks lower interest rates on savings, reducing the incentives for people to save money. Reduced interest rates also make loans and credit more accessible to consumers, allowing them to purchase goods and services.
Aggregate Demand and Supply
Aggregate supply (AS) is the supply of goods and services produced within an economy at a given time. It represents the productive capacity of the economy. The difference between AD and AS is that AD only measures what people buy, whereas aggregate supply measures what people produce.
When AD increases, it implies that more consumers want to buy goods or services than producers can produce – so there is a shortage of these products in the market. On the other hand, when AS increases, it means that more businesses can make goods and services than they did before. As a result, prices will fall because there is too much supply for the demand.
The aggregate price level refers to all prices in an economy weighted by their relative importance in satisfying consumer wants. A change in the price level could be due to differences in aggregate demand or aggregate supply. A shift from AD to AS indicates that more goods are produced than consumers demand. Therefore, excess inventory would lead to falling prices. Vice-versa will happen if there is a shift from AS to AD.
Examples of Aggregate Demand (AD)
Let us look at a few examples.
Download this Aggregate Demand Excel Template here –
Example 1
A European nation had 3.5 million in consumer spending, 8 million in investment, 2 million in public spending, and 2 million in net exports over a year. Therefore, let us calculate the AD for it.
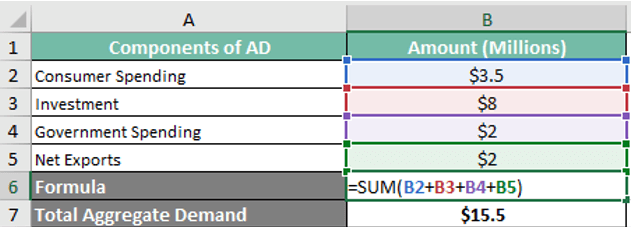
AD = 3.5 Million (Consumer Spending) + 8 Million (Investment) + 2 Million (Government Spending) + 2 Million (Net Exports) = 15.5 Million
It is estimated that this European nation had an AD of 15.5 million that year.
Example 2
A Latin American nation’s consumption expenditures (C) in 2021 were 24 million. Its investment was 38 million. Its public spending was 18 million, and its net exports, calculated by deducting exports from imports, were 5.5 million and 2.5 million, respectively.
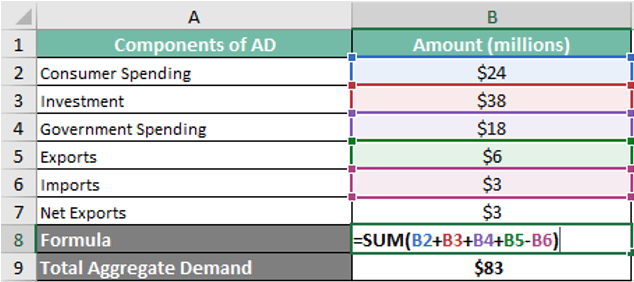
AD = 24 Million (Consumer Spending) + 38 Million (Investment) + 18 Million (Government Spending) + (5.5 – 2.5 Million) (Net Exports) = 83 Million
Therefore, the country had an overall demand of 83 million in 2021.
Frequently Asked Questions(FAQs)
Q1. What is aggregate demand? Give an example.
Answer: AD is the number of goods and services demanded by a country at a given time at a given price level. The accounted-for aggregate demand measures precisely the same as GDP.
An example is when the government lowers the interest rates to increase AD. Low-interest rates urge citizens to take loans, make investments, etc.
Q2. What are the determinants of aggregate demand? What increases aggregate demand?
Answer: The primary drivers of AD are consumer spending, government spending, SME and private sector investments, and the difference between exports and imports.
AD rises as prices fall. When aggregate supply increases, prices fall, and thus the demand increases.
Q3. How to calculate aggregate demand? What is the aggregate demand formula?
Answer: We can calculate AD by totaling its components’ values. Aggregate Demand = Consumption + Investment + Government Spending + (Exports – Imports).
Total Aggregate demand (AD) = C + I + G + (X – M)
Q4. What are the shifts in the AD curve?
Answer: When there is a shift in supply, there is also a shift in demand. When the demand curve shifts right, it explains an increase in demand; when the curve shifts left, it presents a decrease in demand. Both happen due to a factor other than price variation.
Q5. What is aggregate supply?
Answer: Aggregate supply is the total amount of goods and services that a country’s businesses intend to produce and sell in a given time. An increase in supply reduces the price of the products.
Conclusion
The total amount of money traded for goods and services is aggregate demand. Economists calculate the AD of an economy for a given price and time. The four components of AD are consumer spending, government spending, gross investment, and net exports. Any changes in these determinants can increase or decrease the demand.
The AD curve can determine if the demand will increase or decrease. The x-axis of the graph represents the price level, and the Y-axis represents demand(GDP). The increase or fall in demand can cause a right or left curve shift, respectively. Aggregate demand and aggregate supply decide the prices of the country’s products. High supply corresponds to lower costs and lower supply increases prices.
Recommended Articles
This has been a guide to Aggregate Demand (AD). To learn more, visit the following articles:
