Definition: Splunk
Developers use Splunk to analyze and search data, create data models, and visualize results for monitoring and examining large amounts of machine-generated data. Splunk analyzes various types of data including log files, network traffic, and sensor data. Creating reports from Splunk data also helps protect applications from unknown users.
Splunk adds knowledge to your data with the help of knowledge objects, for example, tags, fields, saved searches, reports, dashboards, alerts, etc. These knowledge objects can be shared and reused. Some of these knowledge objects are explained in the rest of the article.
Concept of Splunk Tool
Splunk works in three phases: identification, transformation, and reporting.
It helps in dealing with complex and unpredictable machine data
Before we move ahead, some terminologies should be explained.
1. Machine Data
It can also be considered digital exhaust. Created mainly by systems, technologies, and infrastructures we consume daily.
Some of the sources of Machine data are:
- Amazon Web Services (AWS)
- APM tool logs
- Firewall
- Medical device
- Network Protocol
- Sensor Data
- Web Servers
- System Logs
The insights gained from these data have wide applicability and contribute to many Use Cases across any organisation. But things are not that easy when interacting with this huge data, which is the challenge in leveraging them. These data are dizzying arrays of unpredictable formats, so complex and tough to understand. A traditional tool or platform was not designed to deal with this variety, velocity, variability, and volume of data. This is where Splunk comes into the picture (just like any superhero does).
2. Log Data
Regardless of the size, it can be considered a comprehensive and conclusive record of any aspect of a business. These data have huge possibilities if tapped in the right way. One can understand where things go wrong in a business and organisational loopholes.
Examples
Let’s see some real-time use cases. Use the Splunk tool for VMWARE to understand better what is happening at the operational level in your VMWARE vSphere environment.
Some common use cases are listed below.
1. Inventory management
The Splunk tool platform for VMware collects inventory data, enabling you better to monitor the components in the VMware vSphere environment. In general, these inventory objects include details of hosts, details of virtual machines, data they store, and the network.
All of the dashboards in the Splunk application for VMware display a real-time operational state of the entities in your vSphere environment based on thresholds predefined in the Splunk App for VMware. In addition to reporting, one can also monitor the performance.
2. Performance Monitoring
Look at host details and compare the host in your environment. Monitor the real-time dashboard that visualises performance events across the virtual topology map. Drill down the problem sources and access granular performance metrics using accelerated Splunk enterprise searches. Proactively detecting these performance-related issues and prevention to end users.
Use of Splunk Tool for Dominos
Dominos, an e-commerce giant, faced challenges with its Big Data. They wanted to understand the exact need of their customers and deal with them with accuracy. Here is a list of some Big Data issues they were facing and how Splunk tool helps the organisation with best-fit solutions. Reasons why there was a huge generation of unstructured data:
- Dominos were having Omni-channel for sales
- A huge customer base
- Several points for customer services
- New features for their mobile applications where a user can record the voice for ordering and also with order tracking facilities.
This huge volume of data we’re creating below the problem.
- Tedious manual searches driven by errors.
- Lesser visibility into customers’ needs.
Splunk Home
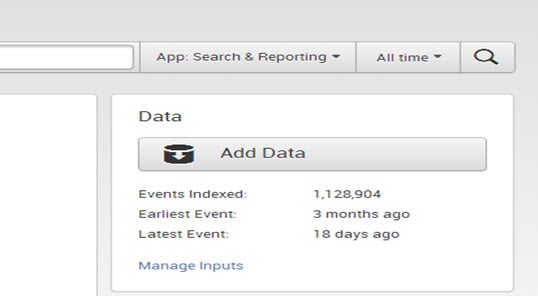
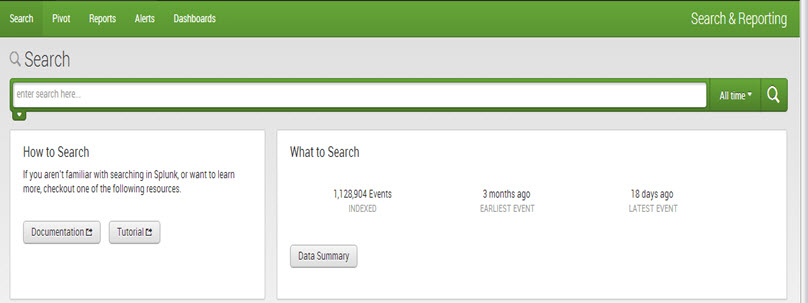
Splunk Home provides access to the apps and data on Splunk. It includes a search bar and three panels: Apps, Data, and Help.
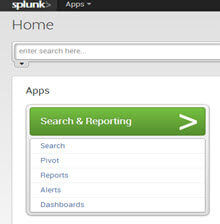
- The ‘Search’ bar is used by the user to run the search query. Both the app search bar and standard Splunk search bar are similar and include a time range picker.
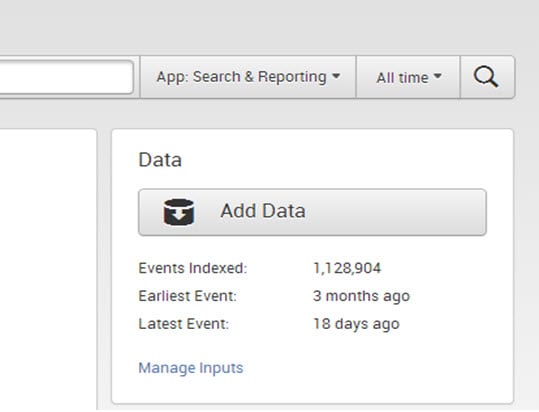
- The ‘Data’ panel manages and adds new data. It shows the indexing history, the earlier and latest events of data, and data volume.
- To enter new data into Splunk, one can simply click on ‘Add Data’ as shown below.
- To view and edit existing input definitions, one can click on ‘Manage Inputs.’
Uploading Data into Splunk
One can upload different types of data into Splunk, such as text files, CSV files, event logs, weblogs, and any machine data. Splunk immediately indexes the data and makes it searchable. Users can run any type of search on the indexed data and create reports, dashboards, charts, etc.
Step 1: Click ‘Add data’ in Splunk Home.
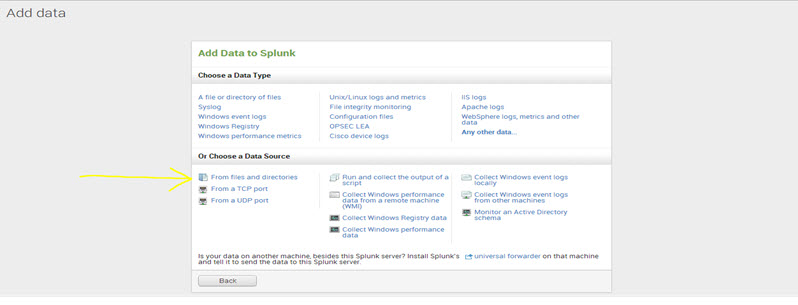
Step 2: Now click ‘From files and directories.’
One can locate it in the section ‘Choose a Data Source.’
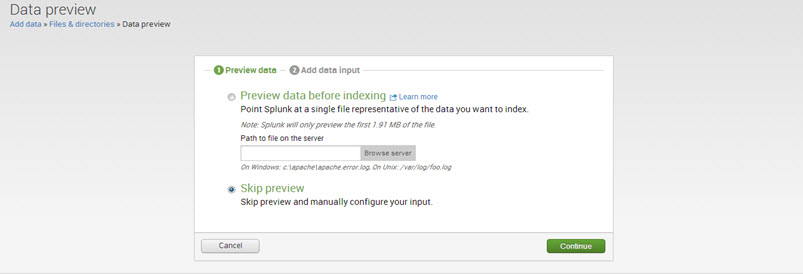
Step 3: There are two options: ‘Preview data before indexing’ and ‘Skip preview.’
If one wants to preview data before indexing, select the ‘preview data’ option and browse the files. Otherwise, select ‘Skip Preview’ and click on ‘Continue.’
Step 4: Select ‘Upload and index a file’ and browse for the data file.
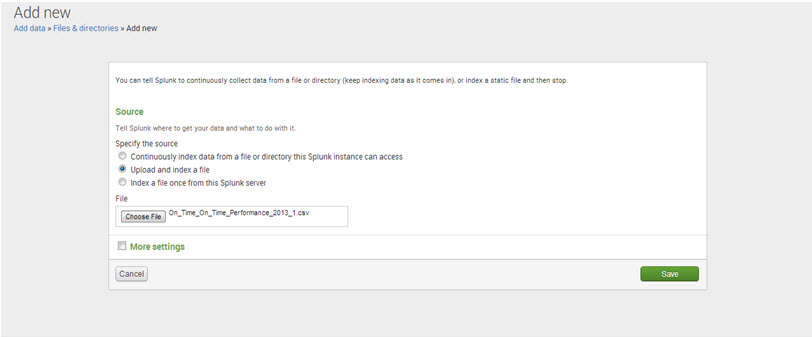
Step 5: More settings
- Under Host, set the values of a ‘Set host’ to “regex on path” and ‘Regular expression’ to “1.”
- For ‘Source type,’ keep it as “Automatic.”
- For the ‘Index,’ keep it as “default.”
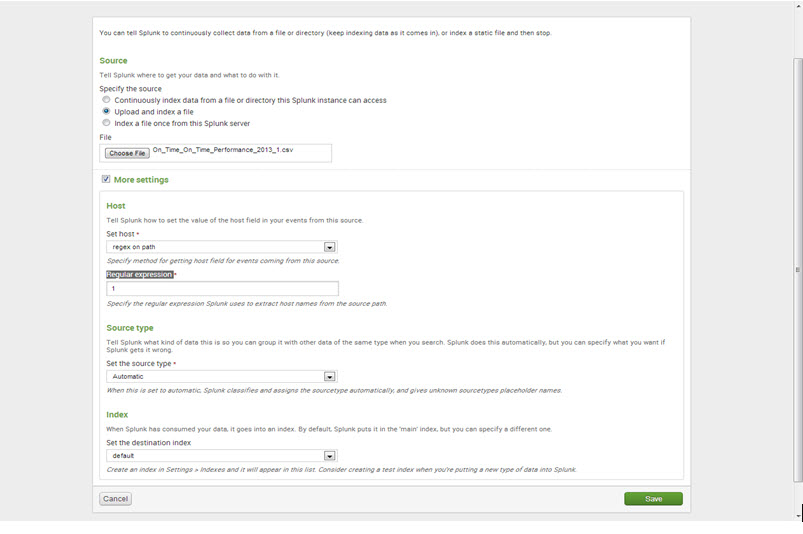
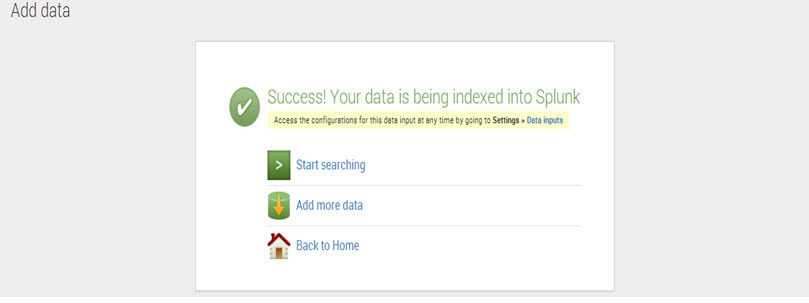
Step 6: Click ‘Save’ and Splunk will display a message of data being successfully indexed.
To commence the search now, click on ‘Start searching.’
What is the Data Summary of Splunk?
To see more details about the uploaded data, click on ‘Data Summary.’
The ‘Data Summary’ dialog displays three tabs: Hosts, Sources, and Sourcetypes.
1. The host of an event is typically the hostname, IP address, or fully qualified domain name of the network machine.
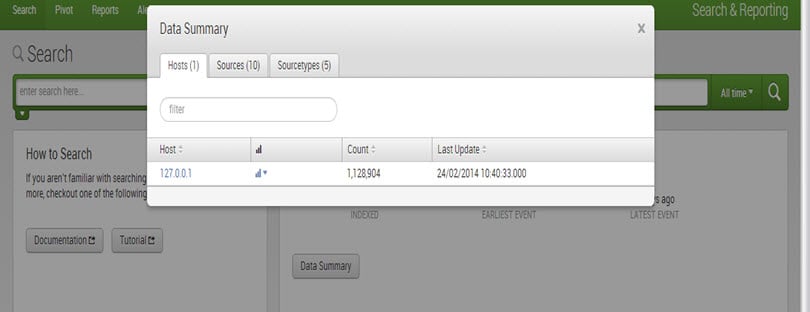
2. The source of an event is the file or directory path, network port, or script.
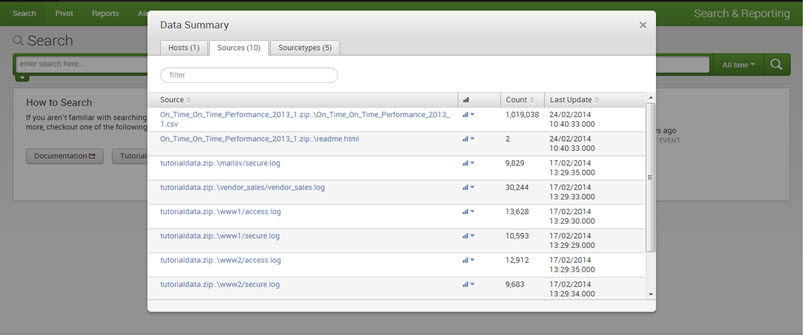
3. The source type of event describes what kind of data it is, usually based on its formatting.
Search/Advanced Search: Most commonly used commands
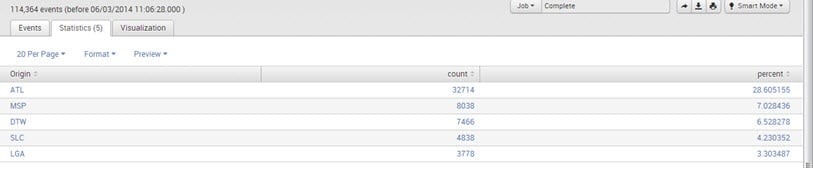
Top/Rare:
The command returns the top and rare values of a given field in the search bar.
E.g., UniqueCarrier=”DL” | top limit=5 Origin

Output:
Stats:
The “stats” command performs statistical calculations over a dataset; it is similar to SQL aggregation. Not just the “stats” command, but the “chart” and “time chart” commands also perform the same statistical calculations on your data, although they return slightly different outputs.
E.g.,
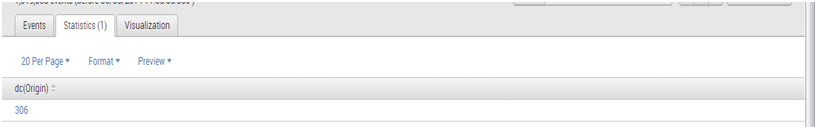
1. sourcetype=”CSV”| stats dc(Origin)

Output:
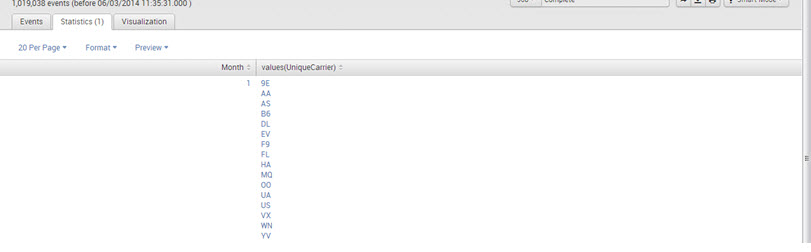
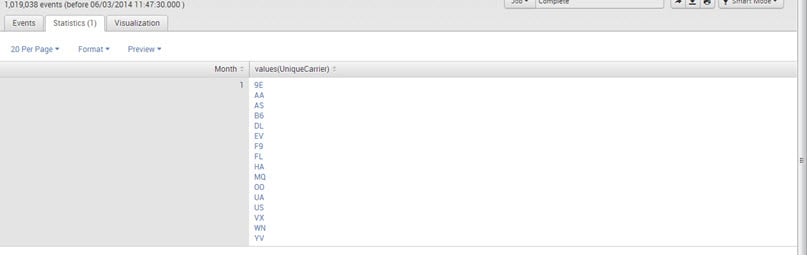
2. sourcetype=”CSV”| stats values(UniqueCarrier) by Month

Output:
Below are the statistical functions that one can use with the stats command:
- Avg(X): Returns the average of the values of field X.
- Count(X): Returns the number of occurrences of the field X.
- Dc(X): Returns the count of distinct values of field X.
- Max(X): Returns the maximum value of field X.
- Min(X): Returns the minimum value of field X.
- Sum(X): Returns the sum of the values of field X.
- Values(X): Returns a list of all distinct values of field X.
Chart:
The “chart” command creates tabular data output that is suitable for charting. One specifies the x-axis variable using “over” or “by.”
E.g., sourcetype=”CSV”| chart values(UniqueCarrier) by Month

Output:
Timechart:
The “timechart” command creates a chart for statistical aggregation of a particular field over time, with time representing the x-axis.
E.g., sourcetype=”csv”| timechart values(UniqueCarrier) by Month

Output:
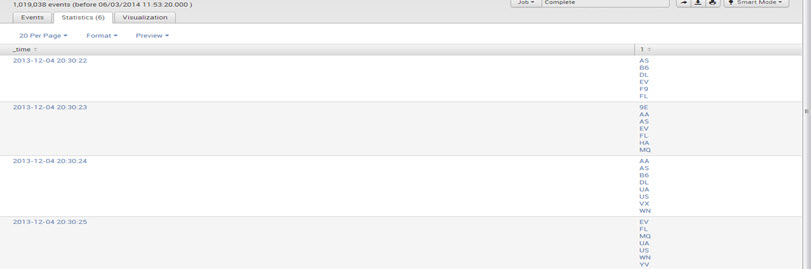
Table:
The command returns a table that is formed by the fields used in the search argument list.
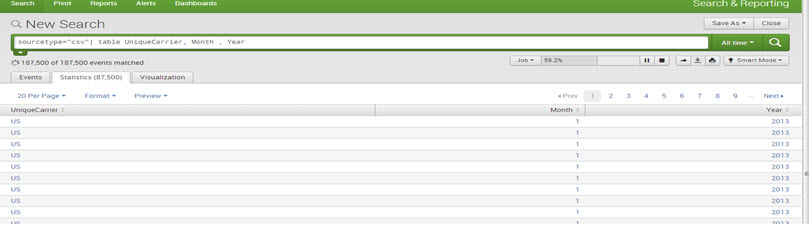
E.g., sourcetype=”csv”| table UniqueCarrier, Month , Year
Dedup:
The “dedup” filtering command removes the redundant data.
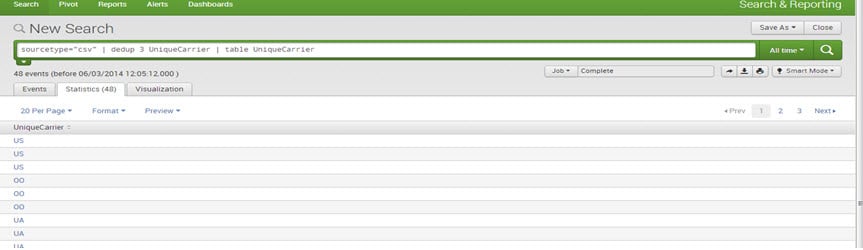
E.g., sourcetype=”csv”| dedup 3 UniqueCarrier | table UniqueCarrier
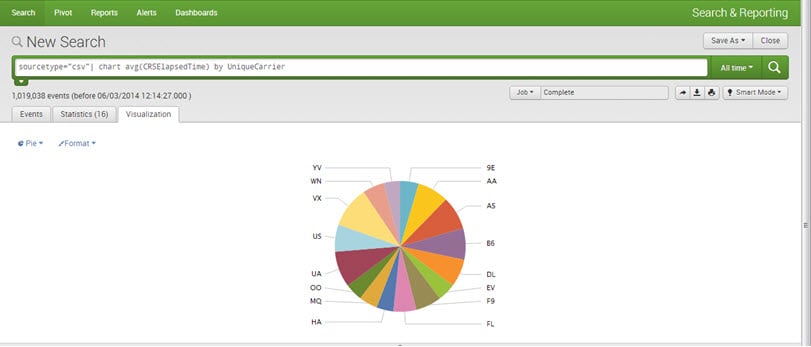
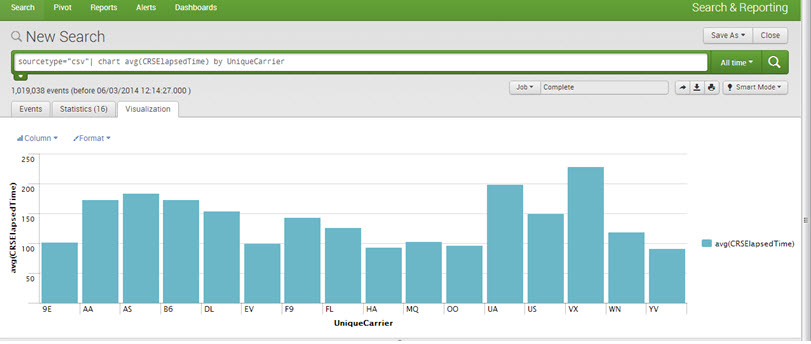
Visualizations:
One can create Reports and Charts for better visualization and understanding. All kinds of charts can be drawn, for example, pie, line, bar, area, etc.
E.g., sourcetype=”csv”| chart avg(CRSElapsedTime) by UniqueCarrier
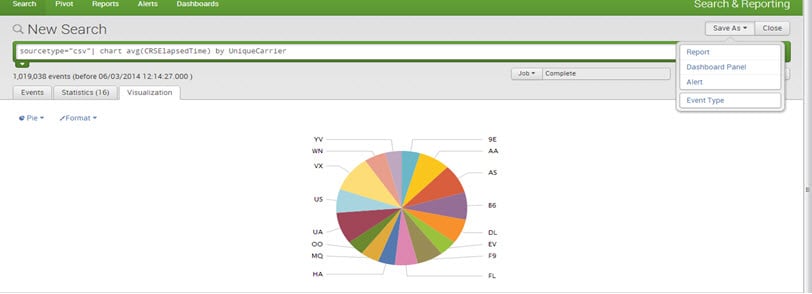
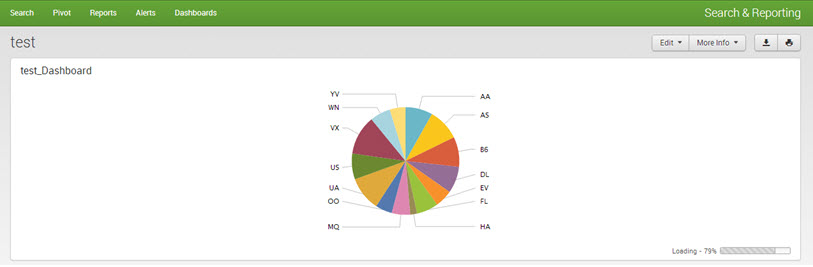
Dashboards:
Dashboards are a key feature of Splunk. They comprise one or more panels, which can display various types of visualizations such as charts, tables, event lists, and maps. In essence, dashboards are a collection of saved searches and reports that provide an excellent overview of important metrics and data points.
To create a dashboard, save a ‘chart/report’ as a ‘dashboard panel.’
Mention the dashboard title, description, and panel title and save it.
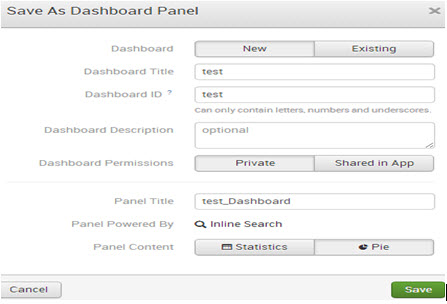
The dashboard has been now created successfully. Click on ‘View Dashboard’ to view it.
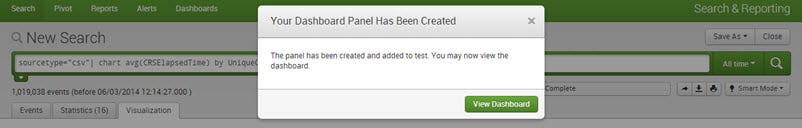
Output:
Top 15 Uses of Splunk
Below is the list of the top 10 uses of Splunk:
- IT Operations Monitoring and Troubleshooting: Splunk can monitor IT infrastructure, servers, applications, and networks in real time. It helps detect issues, troubleshoot problems, and ensure optimal performance.
- Security and Compliance: Splunk aids in identifying and responding to security threats, breaches, and vulnerabilities. It assists in compliance with industry regulations by providing detailed audit trails and monitoring.
- Business Analytics and Insights: Organizations use Splunk to analyze business data, customer behavior, market trends, and operational efficiency. It helps in making informed decisions and identifying growth opportunities.
- DevOps and Application Management: Splunk assists in monitoring application performance, identifying bottlenecks, and improving user experiences. It enables efficient collaboration between development and operations teams.
- Fraud Detection: Splunk can be used to detect unusual patterns or anomalies in data that might indicate fraudulent activities or unauthorized access.
- Predictive Analytics: By utilizing machine learning and AI capabilities, Splunk can help predict future trends, behaviors, and potential issues based on historical data.
- Internet of Things (IoT) Data Analysis: Splunk is well-suited for processing and analyzing data generated by IoT devices, enabling insights and actions based on real-time sensor and device information.
- Application Monitoring and Performance Optimization: For software and web applications, Splunk can provide insights into user experiences, track performance metrics, and help optimize application responsiveness.
- Customer Experience Management: Splunk can help organizations understand customer interactions, preferences, and pain points by analyzing data from various touchpoints.
- Operational Intelligence: Splunk provides a holistic view of business operations by aggregating and analyzing data from diverse sources, enabling organizations to make data-driven decisions.
- Health and Medical Data Analysis: In healthcare, Splunk can be used to monitor medical devices, patient data, and operational systems for better patient care and resource allocation.
- Financial Services and Fraud Prevention: Financial institutions use Splunk to analyze transaction data, identify suspicious activities, and prevent fraud.
- Marketing and Campaign Analysis: Splunk can help marketers analyze campaign performance, track customer interactions, and optimize marketing strategies.
- Supply Chain and Inventory Management: Splunk can monitor and optimize supply chain processes, ensuring efficient inventory management and timely delivery of products.
- Energy and Utilities Monitoring: In the energy sector, Splunk can help monitor energy consumption, predict equipment maintenance needs, and improve overall operational efficiency.
Conclusion
Splunk stands as a robust and versatile tool that empowers organizations to harness the potential within their machine-generated data. Its comprehensive features, ranging from data collection and real-time monitoring to advanced analytics and security enhancements, make it an indispensable asset across various industries and use cases. Splunk’s ability to transform raw data into actionable insights, coupled with its flexibility in deployment options and strong community support, positions it as a potent solution for managing the challenges of today’s data-driven world. As technology continues to evolve, Splunk remains a steadfast companion, guiding organizations toward informed decision-making, streamlined operations, heightened security, and innovation-driven growth.
Recommended Articles
Please refer to the following articles for additional information related to Splunk:
