Updated July 24, 2023
Trend Analysis Formula (Table of Contents)
What is the Trend Analysis Formula?
The term “Trend Analysis” refers to one of the most useful analytical tools employed for financial analysis of statements such as income statements, balance sheets, and cash flow statements.
In other words, trend analysis compares the movement in each line item across time periods in order to draw actionable insights. It basically indicates the change either in terms of amount or as a percentage change year over year (Y-o-Y).
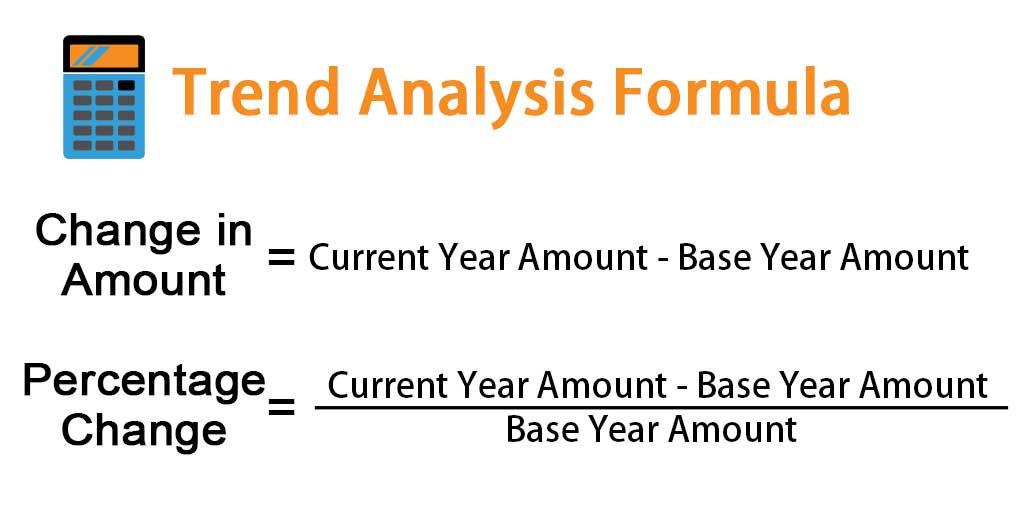
The formula for trend analysis (change in amount) can be derived by subtracting the base year amount from the current year amount. Mathematically, it is represented as,
Formula –
The formula for trend analysis (percentage change) can be derived by dividing the difference between the current year amount and the base year amount by the base year amount. Mathematically, it is represented as,
Formula –
Example of Trend Analysis Formula (With Excel Template)
Let’s take an example to understand the calculation of the Trend Analysis Formula in a better manner.
Trend Analysis Formula – Example #1
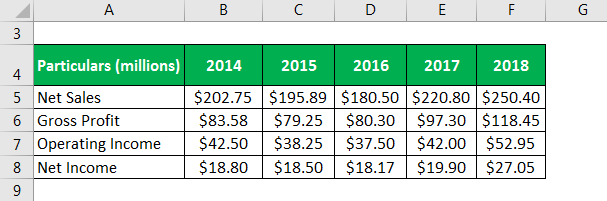
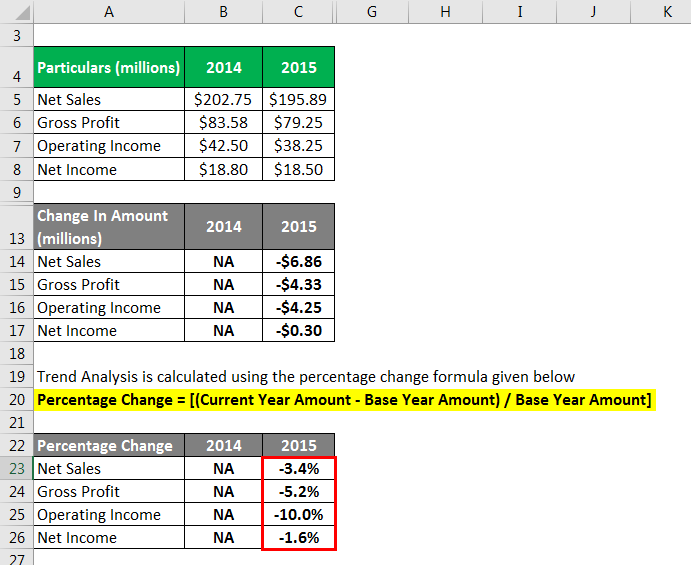
Let us take the example of a company DFG Inc. which is engaged in the manufacturing of customized machine parts. The following income statement information is available for the last five years:
Solution:
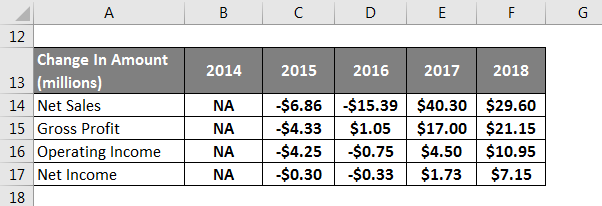
Trend Analysis is calculated using the change in amount formula given below.
Change in Amount = Current Year Amount – Base Year Amount
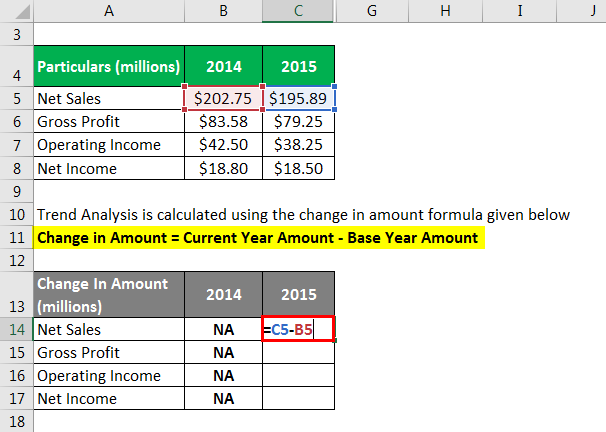
The year 2015 is calculated using the above-given formula.
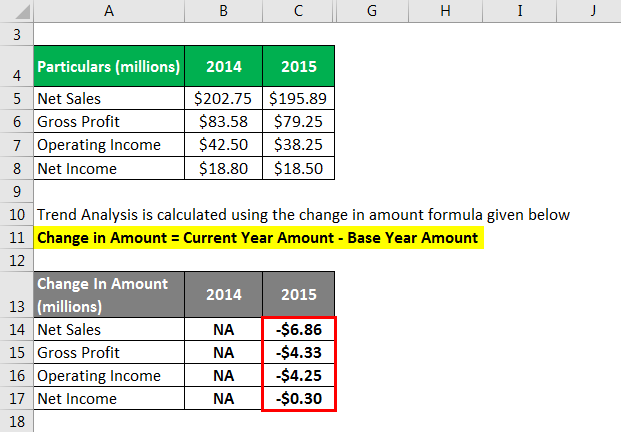
Similarly, Calculated the year 2016, 2017, 2018 by the given formula.
Trend Analysis is calculated using the percentage change formula given below.
Percentage Change = [(Current Year Amount – Base Year Amount) / Base Year Amount]
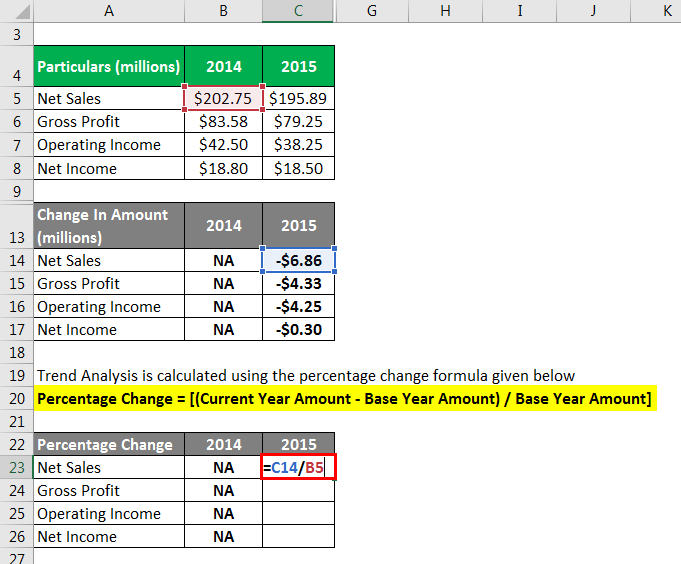
The year 2015 is calculated using the above-given formula.
Similarly, Calculated the year 2016, 2017, 2018 by the given formula.
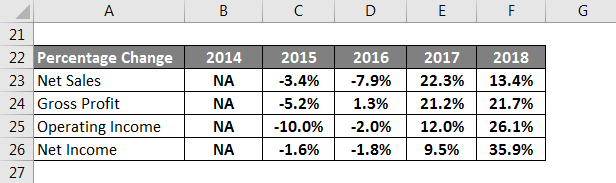
In the above tables, it can be seen that:
- The company witnessed deterioration in its financials in the year 2015 and 2016. However, since then, the company’s financials have been on an uptrend for the last two years.
- The company’s profitability experienced the highest growth in the year 2018, which may indicate that it has been able to improve its operational efficiency. Although, the growth in net income can also be due to some non-operating income.
- Overall, the company is trending up, which may be sustainable in the near term if the market remains favorable.
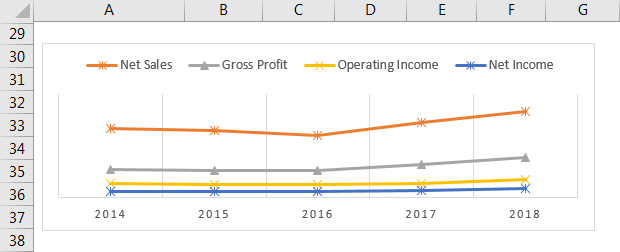
Below is the graphical representation of the trend in each line item.
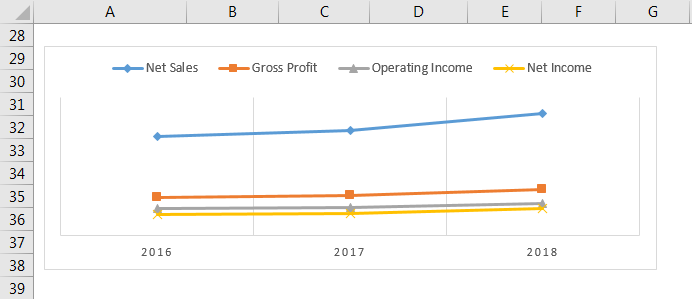
Trend Analysis Formula – Example #2
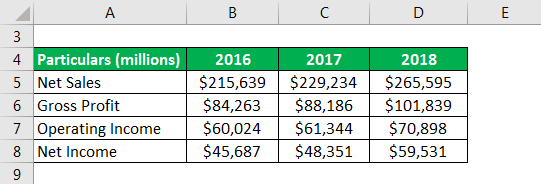
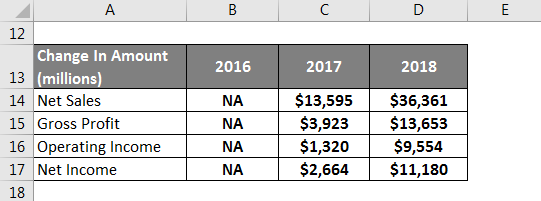
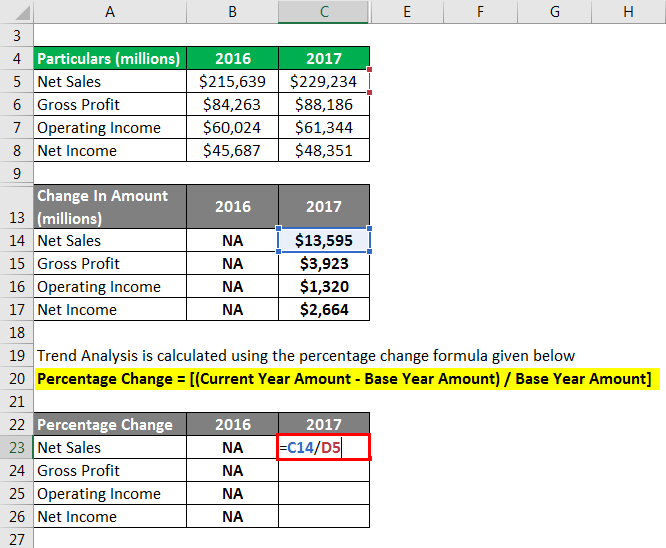
Let us take the example of Apple Inc.’s income statement for the year 2018 to illustrate the concept of trend analysis. The following three years’ information has been extracted from the income statement:
Solution:
Trend Analysis is calculated using the change in amount formula given below.
Change in Amount = Current Year Amount – Base Year Amount
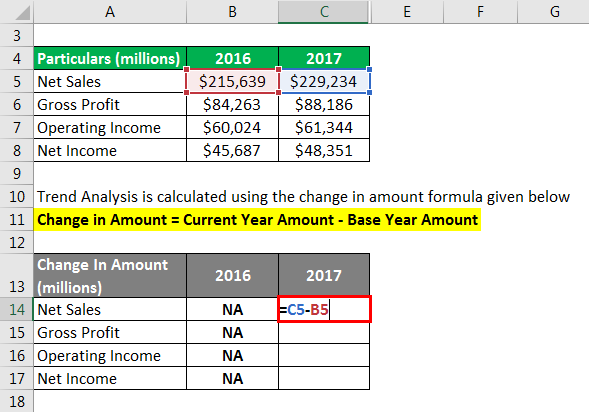
The year 2017 is calculated using the above-given formula.
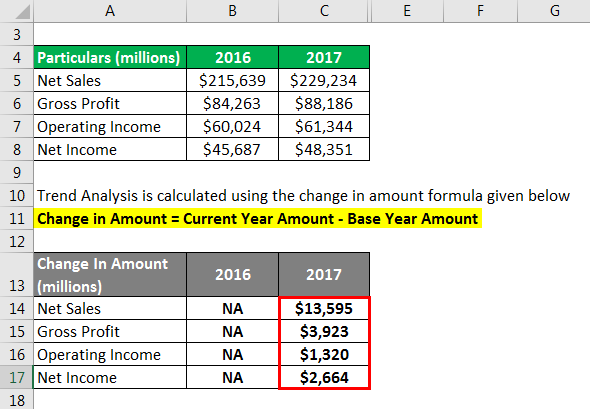
Similarly, Calculated the year 2018 by the given formula.
Trend Analysis is calculated using the percentage change formula given below.
Percentage Change = [(Current Year Amount – Base Year Amount) / Base Year Amount]
The year 2017 is calculated using the above-given formula.
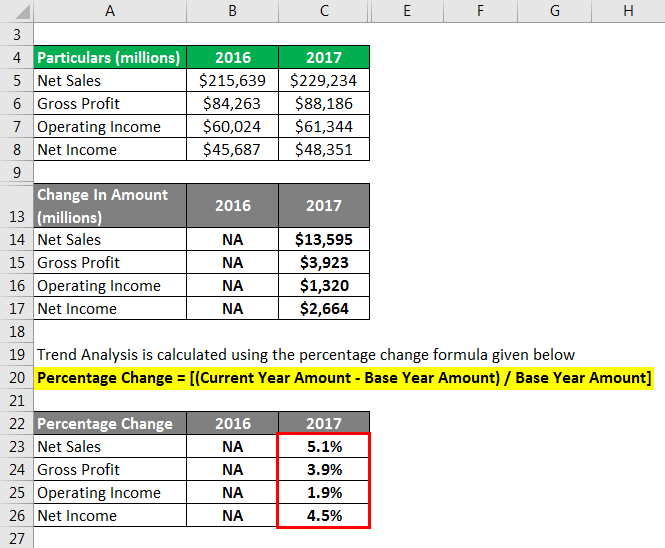
Similarly, Calculated the year 2018 by the given formula.
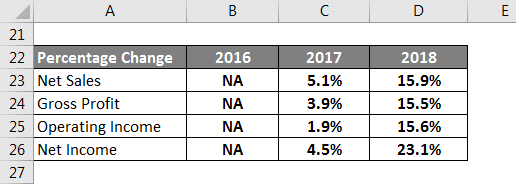
In the above tables, it can be seen that:
- Although the company has grown in the last two years, it has witnessed significant growth in the year 2018.
- The profitability has also moved in tandem with the revenue, which is always a good sign as it indicates better operational control.
- The net income in the year 2018 has witnessed relatively higher growth due to lower provision for taxes.
Below is the graphical representation of the trend in each line item.
Source Link: Apple Inc. Balance Sheet
Explanation
The Trend Analysis Formula can be calculated by using the following steps:
Step 1: Firstly, decide the base year and then note down the subject line item’s value in the base year.
Step 2: Next, note down the value of the line item in the current year.
Step 3: Now, the formula for trend analysis in terms of change in amount can be derived by subtracting the base year amount (step 1) from the current year amount (step 2), as shown below.
Change in Amount = Current Year Amount – Base Year Amount
Step 4: On the other hand, the formula for trend analysis in terms of percentage change can be derived by dividing the change in amount (step 3) by the base year amount (step 1), as shown below.
Percentage Change = [(Current Year Amount – Base Year Amount) / Base Year Amount]
Relevance and Use of Trend Analysis Formula
It is important to understand the concept of trend analysis because it helps in the assessment of future movement based on historical figures. It is also helpful in identifying any stark deviation, which can indicate irregularity in financial reporting or business downtrend. A market is said to be on the uptrend if the asset prices move in an upward direction, i.e. keep increasing over a certain period of time. On the other hand, a downtrend market indicates that asset prices are moving in a downward direction, i.e. decreasing.
Trend Analysis Formula Calculator
You can use the following Calculator:
| Current Year Amount | |
| Base Year Amount | |
| Change in Amount | |
| Change in Amount = | Current Year Amount – Base Year Amount |
| = | 0 – 0 |
| = | 0 |
Recommended Articles
This is a guide to the Trend Analysis Formula. Here we discuss how to calculate it along with practical examples. We also provide a calculator with a downloadable excel template. You may also look at the following articles to learn more –
