Updated July 24, 2023
Sampling Error Formula (Table of Contents)
What is the Sampling Error Formula?
The term “Sampling Error” refers to the estimation error due to variance between the statistical characteristic of a population and a sample, which is the subset of the same population.
In other words, it measures the inaccuracy of the sample’s statistical characteristics from that of the population since it doesn’t include all population members. The higher value of sampling error indicates that the sample statistics are less representative of the actual population parameters. The formula for sampling error derives from the confidence level of the estimation, sample size, population size, and proportion of the population expected to respond in a certain way. Mathematically, it can be represented as follows:
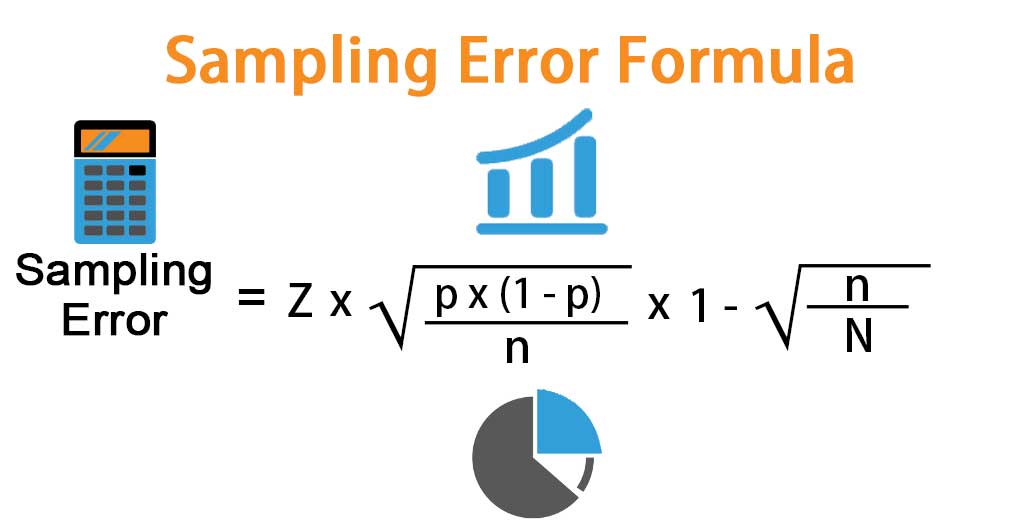
Formula
Where,
- Z: Z-Score for the Confidence Level Selected.
- n: Sample Size.
- N: Population Size.
- p: Proportion or Percentage of people surveyed who are expected to respond in a certain way.
Example of Sampling Error Formula (With Excel Template)
Let’s take an example to understand the calculation of Sampling Error in a better manner.
Sampling Error Formula – Example #1
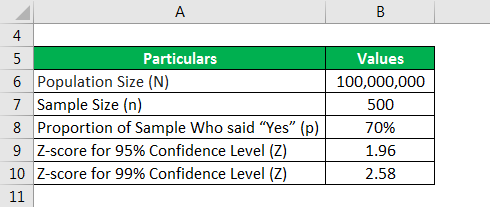
Let us take the example of a sample of 500 people from an entire population of 100 million who were surveyed on whether or not they like Vanilla ice creams. 70% of the sample responded positively, saying they like Vanilla ice creams. Calculate the sampling error for a 95% Confidence Level and 99% Confidence Level.
Solution:
Sampling Error is calculated using the formula given below
Sampling Error = Z * √(p * (1 – p) / n) * (1 – √(n /N))
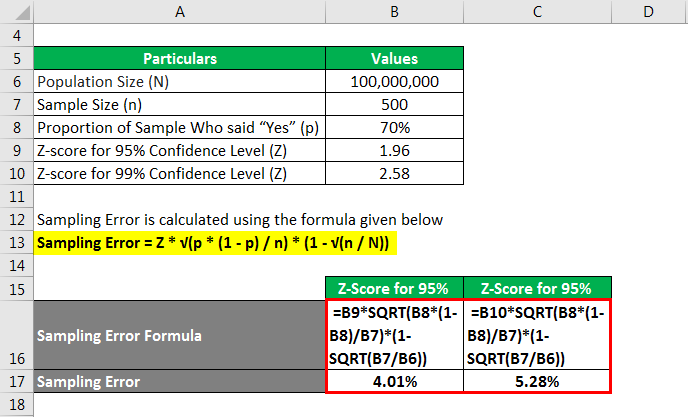
z-score at 95%
- Sampling Error = 1.96 * √[70% * (1 – 70%) / 500] * [1 – √(500 / 100000000)]
- Sampling Error = 4.01%
Therefore, the sampling error for the sample at a 95% confidence level is 4.01%.
z-score at 99%
- Sampling Error = 2.58 * √[70% * (1 – 70%) / 500] * [1 – √(500 / 100000000)]
- Sampling Error = 5.28%
Therefore, the sample’s sampling error at a 99% confidence level has increased to 5.28%.
Therefore, increasing the confidence level results in an increase in the sampling error of any given sample.
Sampling Error Formula – Example #2
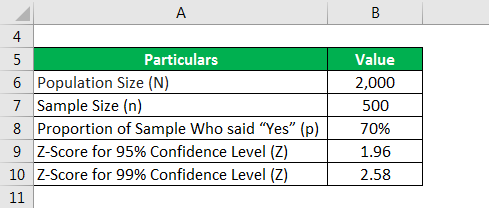
Now, again let us take the example of the above example and keep everything the same except the population size, which is assumed to be significantly lower in this case, say 2,000. Calculate the sampling error for a 95% confidence level and a 99% confidence level.
Solution:
Sampling Error is calculated using the formula given below
Sampling Error = Z * √(p * (1 – p) / n) * (1 – √(n /N))
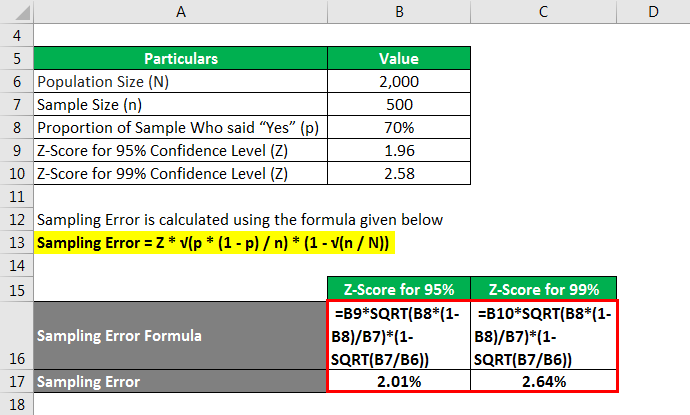
z-score at 95%
- Sampling Error = 1.96 * √[70% * (1 – 70%) / 500] * [1 – √(500 / 2000)]
- Sampling Error = 2.01%
Therefore, the sampling error for the sample at a 95% confidence level is 2.01%.
z-score at 99%
- Sampling Error = 2.58 * √[70% * (1 – 70%) / 500] * [1 – √(500 / 2000)]
- Sampling Error = 2.64%
Therefore, the sampling error for the sample at a 99% confidence level is 2.64%.
Therefore, decreasing the population size leads to a decrease in sampling error. So, samples are a better representative of the smaller data population.
Explanation
The formula for Sampling Error analysis can be computed by using the following steps:
Step 1: Firstly, decide on the confidence level for the estimation. The z-score, denoted by “Z,” can be determined based on the selected confidence level. For instance, the z-score for a 95% confidence level is 1.96.
Step 2: Next, determine the sample size for the estimation. Next, you should determine the percentage of survey participants who will answer “yes” to the question asked. It is denoted by “n.”
Step 3: Next, determine the size of the entire population denoted by “N.”
Step 4: Next, you must determine the percentage of survey participants responding positively or saying “yes” to the question being asked. The percentage denoted by “p” represents the proportion of the population with a specific response. In this case, (1 – p) would denote the percentage of people with the alternate response.
Step 5: The formula for deriving the sampling error can be based on the following steps and variables: confidence level of the estimation (step 1), sample size (step 2), population size (step 3), and proportion of the population with a set response (step 4).
Sampling Error = Z * √(p * (1 – p) / n) * (1 – √(n /N))
Relevance and Use of Sampling Error Formula
It is essential to understand the concept of sampling error as it indicates the inaccuracy of the sample survey. A higher value of sampling error means that the survey may not be the true reflection of the population. On the other hand, a smaller value is desirable as it indicates that the sample parameters are close to that of the total population.
Sampling Error Formula Calculator
You can use the following Sampling Error Formula Calculator
| Z | |
| p | |
| n | |
| N | |
| Sampling Error | |
| Sampling Error = | Z * √[p * (1 - p) / n] * [1 - √(n/N)] | |
| 0 * √[0 * (1 - 0) / 0] * [1 - √(0/0)] = | 0 |
Recommended Articles
This is a guide to Sampling Error Formula. Here we discuss how to calculate the Sampling Error along with practical examples. We also provide a Sampling Error calculator with a downloadable Excel template. You may also look at the following articles to learn more –
