Updated October 19, 2023
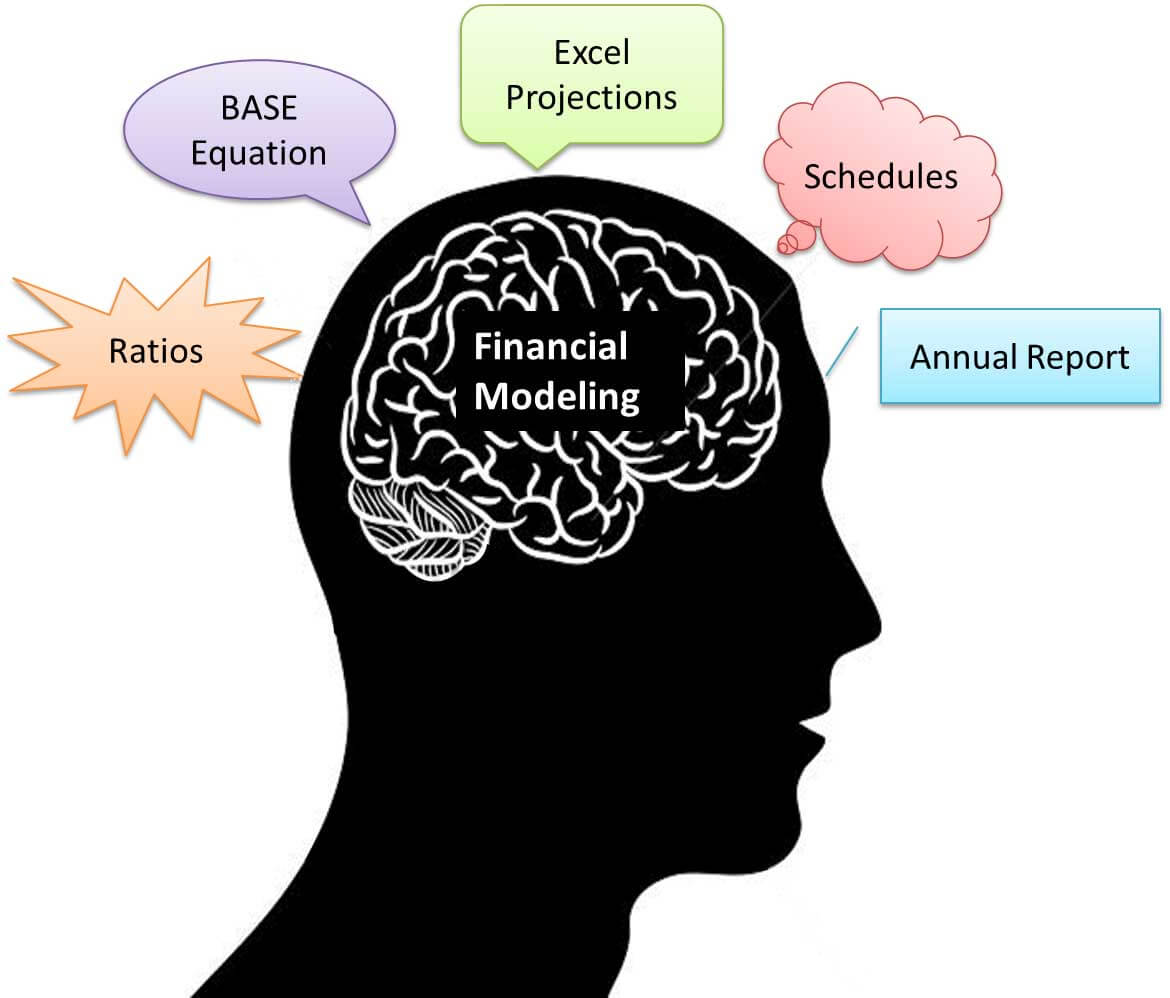
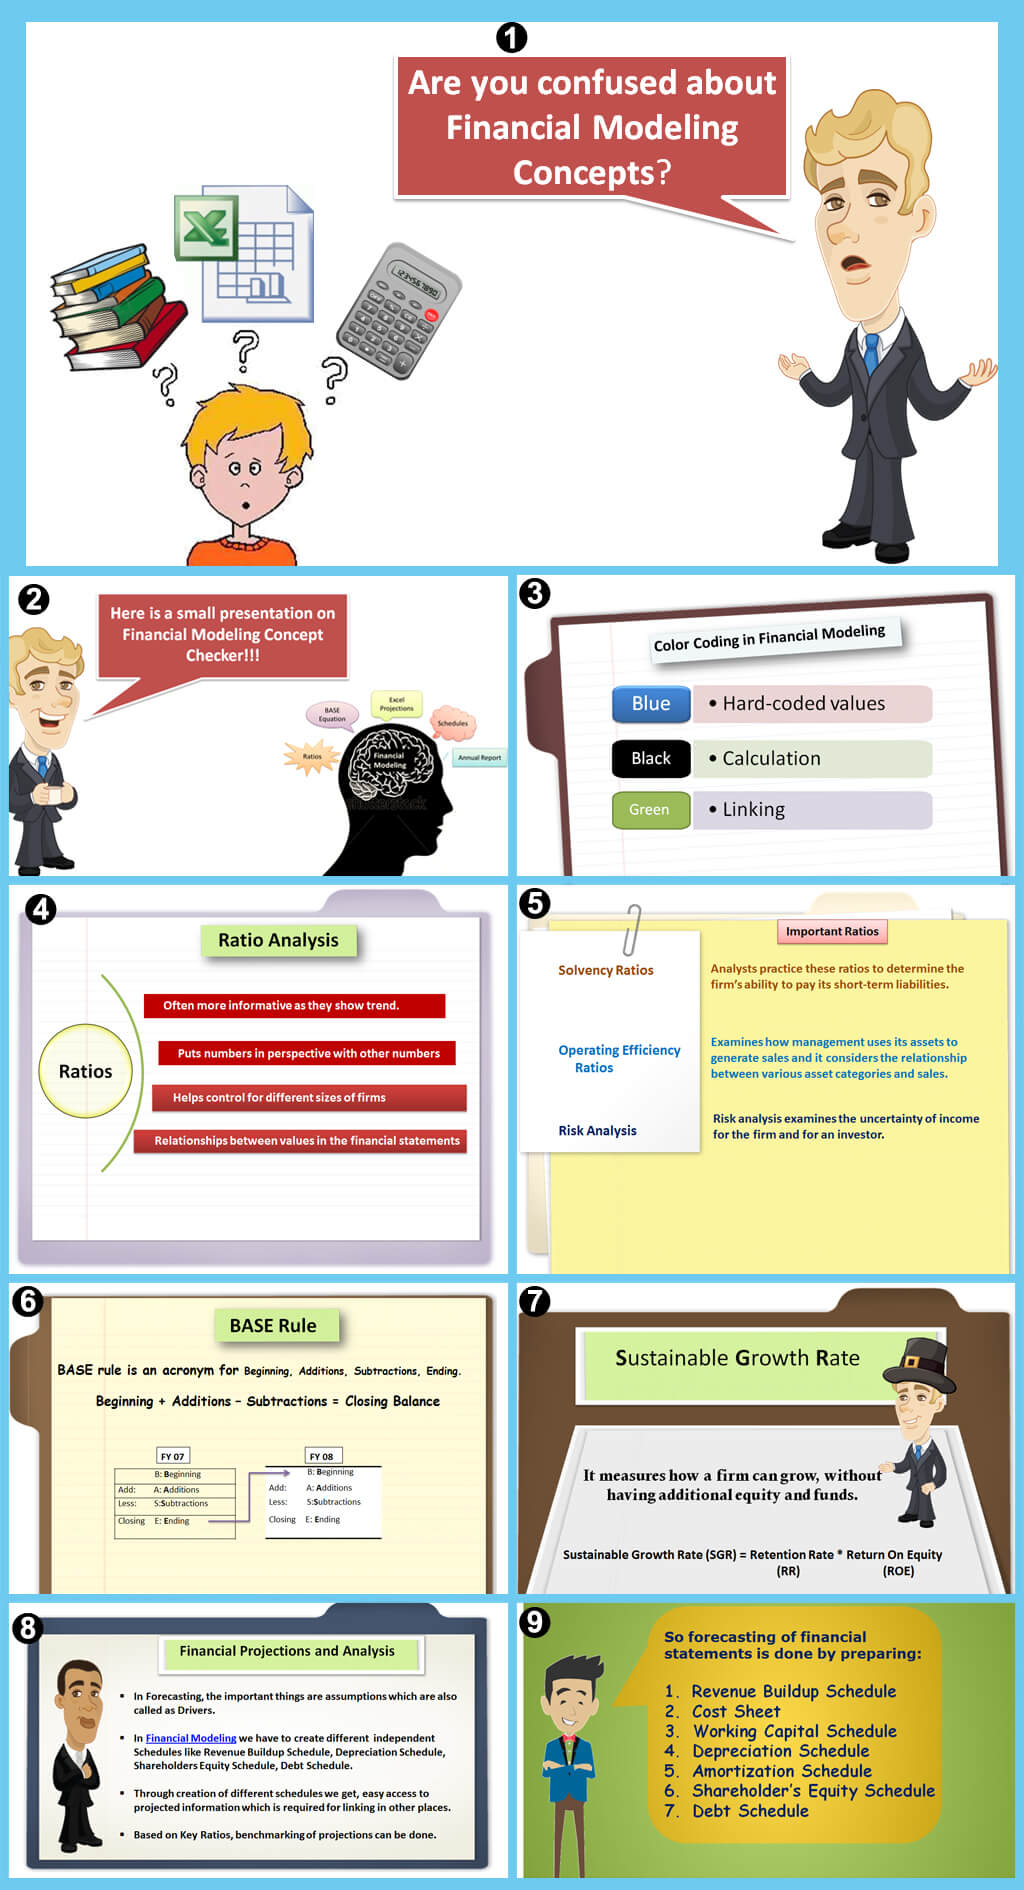
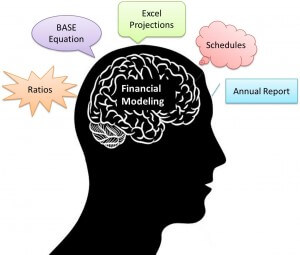 Are you Doing Financial Modeling?
What you need to know is:
- Knowledge about the purpose and audience.
- Identification of key drivers in the financial business.
- Knowledge of accounting and financial statement analysis.
Financial Modeling is, in fact, about projections, and it should indicate the following kinds of final “output”:
- Income Statements
- Balance Sheets
- Sources and Uses of Cash Statements (Cash Flow Statements)
Following are the Top 12 Financial Modeling Concept Checkers that one Should be Aware of:
1. What should be the color coding in Financial Modeling?
While preparing Excel-based financial models, using different colors for better understanding is a good and standard practice. So, in Excel Best Practices, we use different colors for links, constants, and formulas.
• Blue Font Color: This color is used for hard-coded values that are entered manually. It is used for historical financial data and assumptions part of the cell.
• Black Font Color: We use black to represent cells calculated from linking other cells.
• Green Font Color: Green color is used for the linkages purpose, that is, wherever there is a need for linking values from other sheets or workbooks.
2. Why is ratio analysis done?
- Ratios can often be more informative than raw numbers
- Put numbers in perspective with other numbers
- Helps control for different sizes of firms
- Ratios provide meaningful relationships between individual values in financial statements.
Important Ratios
Solvency Ratios: Analysts practice these ratios to determine the firm’s ability to pay its short-term liabilities.
These ratios include:
- Current Ratio/Quick Rati /Cash ratio.
- Receivables turnover/Inventory turnover/Payables turnover/Cash Conversion Cycle.
Operating Efficiency ratios: Examines how management uses its assets to generate sales and considers the relationship between various asset categories and sales.
- Operating Profitability
- DuPont Formula
- Extended DuPont Formula
Risk: Risk analysis examines the firm’s and an investor’s income uncertainty.
Total firm risks can be decomposed into three basic sources –
- Business Risk
- Financial risk
- External liquidity risk
Limitation of Financial Ratios
- Accounting treatments may vary among firms, especially among non-U.S. firms.
- Always consider relative financial ratios. They do not make any sense when viewed in isolation.
- Firms may have divisions operating in different industries, making it difficult to derive industry ratios.
- Conclusions cannot be made by looking at only one set of ratios.
- Ratios outside an industry range may be cause for concern.
3. What is SGR?
SGR stands for Sustainable Growth Rate. It measures how a firm can grow without having additional equity and funds.
4. What is the BASE Rule?
The BASE rule is an acronym for Beginning, Additions, Subtractions, and Ending.
For a financial year, we have a beginning balance, last year’s remainings, into which items’ additions and subtractions are made. Finally, whatever remains is your closing balance, which will be an opening balance for the next year.
| FY 07 | FY 08 |
|---|---|
| B: Beginning | B: Beginning |
| Add: A: Additions | Add: A: Additions |
| Less: S: Subtractions | Less: S: Subtractions |
| Closing E: Ending | Closing E: Ending |
5. How to do Financial Projections and Analysis?
The basic financial statements of any company are Income statements, Balance sheets,s and Cash flow statements.
In Forecasting, the important things are assumptions, also called Drivers, as these drivers cause the projections of financial statements. Drivers are calculated based on historical information. These assumptions include growth rate, Costs incurred, capital expenditure, etc.
In Financial Modeling, we have to create independent Schedules like Depreciation schedules, Shareholder’s Equity schedules, Shares Outstanding Schedules, and Debt Schedules. Creating different schedules allows easy access to project information required for linking elsewhere.
To calculate expenses, we group them by departments according to the industry we are modeling. General categorizations of expenses include General and Admin Expenses, Research and Development, and Sales & Marketing Expenses.
Based on Key Ratios, benchmarking of projections can be done.
Sensitivity analysis is a way to check for the impact of changes in major assumptions.
6. What is Revenue Buildup?
A revenue buildup schedule is prepared for estimating a company’s sales. For forecasting the revenue of companies, various factors can be considered. One of them is geography.
With revenue buildup, you get an idea of where your projections are coming from and their potential variance.
7. How are Costs Projected?
A cost sheet is a document that reflects the cost of the products or the services required for a particular project or the department for the performance of the business. The cost sheet consists of DIRECT COSTS like the cost of materials, purchase of stock in trade, etc., and INDIRECT COSTS like employee benefits and other expenses.
These historical costs are computed as a percentage of sales, and based on historical values, assumptions are made, and future costs are projected.
8. What is Working Capital?
Net working capital is the difference between non-cash current assets and non-debt current liabilities.
These net working capital components are often projected as percentages of sales or COGS.
Here, we have imputed important ratios such as accounts receivable days, accounts payable days, inventory days, and inventory turnover.
9. What is Depreciation?
In business, we have assets that last for more than a certain amount of years, e.g., Buildings, machinery, equipment, furniture, computers, and outdoor lighting, but these assets will not last indefinitely.
The company uses up a portion of the cost of these assets during each accounting period, such as a year, quarter, or month. This portion is reported as Depreciation Expense on the income statement.
Depreciation transfers a portion of an asset’s cost from the balance sheet to the income statement each year of the asset’s useful life.
Following is a rough guideline on the preparation of the Depreciation schedule:
a. Create the required line items
b. Reference net sales as the driver
c. Enter past capital expenditures
d. Project capital expenditures estimated over the forecast period
e. Reference past PP & E balances
f. Depreciation Expense– Forecasted depreciation from existing PP & E
– Forecasted depreciation from new Capex
– Calculate the Total Depreciation Expenseg. Complete Net PP & E table
h. Calculate relevant ratios
i. Consider the Capex and PP & E and make adjustments (smoothen the curve!) as required
j. Link up the following in the model
– Depreciation Expense to Income Statement
– Depreciation and Capex to Cash Flow Statement
– Net PP & E to Balance Sheet
10. What is Amortization?
Amortization is similar in concept to depreciation. This term is used with mortgage loans. The lender often provides the borrower with a loan amortization schedule. With the amortization schedule, the borrower can see how the loan balance will be reduced over the life of the loan.
Following is a rough guideline on the preparation of the Amortization schedule:
a. Create the lines items
b. Reference net sales as a driver
c. Fill in details of past additions to intangibles
d. Forecast estimated additions to intangibles
e. Reference past intangibles balances
f. Amortization expense
-Forecast amortization from existing intangibles
-Forecast amortization from additions to intangibles
– Calculate total amortization expense
g. Complete the amortization table and calculate the required ratios
h. Link up the following
– Amortization to Income Statement
– Amortization and additions to intangibles to Cash Flow Statement
– Intangibles to Balance Sheet
11. What is Shareholder’s Equity?
Shareholders’ equity includes the firm’s total assets minus its total liabilities. Another way to calculate stockholders’ equity is to add share capital and retained earnings and then subtract treasury shares.
Shareholders’ Equity = Total Assets-Total Liabilities
Shareholders’ Equity = Share Capital + Retained Earnings – Treasury Shares
Share capital, net worth, or stockholders’ equity are alternative terms used to refer to the same concept.
Following is a rough guideline on the preparation of the Shareholder’s Equity schedule:
a. Equity Schedule Overview
b. Set up the line items and input past information
c. Forecast
– Share Repurchases
– Option proceeds & new shares issued for exercised options
– Dividends
– Future equity balancesd. Link up
– Ending balances to Balance Sheet
– Repurchase, options and dividends to Cash Flow Statement
12. What Amount of Debt is Required?
When the company requires funds, it borrows them from lenders as an obligation the borrower owes to the lender of funds. We call this Debt, which includes the principal amount and the associated cost, known as Interest Expense. The debt can be bonds, mortgages, or bank loans.
General steps to be performed for making debt schedule:
a. Calculate Cash Flow Available for Debt Repayment
-Reference in past information on Long Term Debt
-Make sure to enter the mandatory Long Term Repayments (refer to repayment schedule provided in the Annual Report in the discussion on Debt Section)
-Calculate forecasted Long Term Debt Repaymentsb. Calculate Cash Flow Available for Revolver
– Revolver = Cash Sweepc. Calculate Interest Expense/ Income
– Refer to average debt balances
-Revolver interest expenses
– Long Term interest expenses
– Cash Balance for Interest/ Incomed. Link Up
-Forecasted interest expense/ income to Income Statement
-Forecasted debt repayments/ borrowings to Cash Flow Statement
-Forecast debt balances to the Balance Sheet
Top 12 Financial Modeling Concept Checkers
Learn the juice of this article in just a single minute Top 12 Financial Modeling Concept Checkers Infographic.
Also, have a look at this Financial Modeling Course. This course is a bundle of 10+ Sector Financial Modeling tutorials.
You can also learn Financial Modeling here.
Recommended Articles
This is a guide to the Top 12 Financial Modeling Concept Checkers. Here are some articles that will help you get more details about Financial Modeling, so just go through the link.
