EDUCBA

EDUCBA

MENUMENU
  • Free Tutorials
  • Free Courses
  • Certification Courses
  • 360+ Courses All in One Bundle
  • Login
Home Data Science Data Science Tutorials Head to Head Differences Tutorial Tableau vs Power BI vs QlikView
Secondary Sidebar
Head to Head Differences Tutorial
  • Differences Tutorial
    • Scikit Learn vs TensorFlow
    • Azure Functions vs Logic Apps
    • Azure Data Factory vs Databricks
    • SHA1 vs MD5
    • Azure SQL Database vs Managed Instance
    • Azure SQL Database vs SQL Server
    • PostgreSQL vs MySQL
    • PostgreSQL vs MySQL Benchmark
    • ArangoDB vs MongoDB
    • Cloud Computing vs Big Data Analytics
    • T-SQL vs SQL
    • PostgreSQL vs MariaDB
    • Spark vs Impala
    • Datadog vs Splunk
    • Domo vs Tableau
    • Data Scientist vs Data Engineer vs Statistician
    • Big Data Vs Machine Learning
    • Predictive Analytics vs Business Intelligence
    • AI vs Machine Learning vs Deep Learning
    • Business Intelligence vs Data Warehouse
    • Apache Kafka vs Flume
    • Data Science vs Machine Learning
    • Business Analytics Vs Predictive Analytics
    • Data mining vs Web mining
    • Data Science Vs Data Mining
    • Data Science Vs Business Analytics
    • Analyst vs Associate
    • Apache Hive vs Apache Spark SQL
    • Apache Nifi vs Apache Spark
    • Apache Spark vs Apache Flink
    • Apache Storm vs Kafka
    • Artificial Intelligence vs Business Intelligence
    • Artificial Intelligence vs Human Intelligence
    • Al vs ML vs Deep Learning
    • SQL vs SQLite
    • Assembly Language vs Machine Language
    • AWS vs AZURE
    • AWS vs Azure vs Google Cloud
    • Big Data vs Data Mining
    • Big Data vs Data Science
    • Big Data vs Data Warehouse
    • Blu-Ray vs DVD
    • Business Intelligence vs Big Data
    • Business Intelligence vs Business Analytics
    • Business Intelligence vs Data analytics
    • Business Intelligence VS Data Mining
    • Business Intelligence vs Machine Learning
    • Business Process Re-Engineering vs CI
    • Cassandra vs Elasticsearch
    • Cassandra vs Redis
    • Cloud Computing Public vs Private
    • Cloud Computing vs Fog Computing
    • Cloud Computing vs Grid Computing
    • Cloud Computing vs Hadoop
    • Computer Network vs Data Communication
    • Computer Science vs Data Science
    • Computer Scientist vs Data Scientist
    • Customer Analytics vs Web Analytics
    • Data Analyst vs Data Scientist
    • Data Analytics vs Business Analytics
    • Data Analytics vs Data Analysis
    • Data Analytics Vs Predictive Analytics
    • Data Lake vs Data Warehouse
    • Data Mining Vs Data Visualization
    • Data mining vs Machine learning
    • Data Mining Vs Statistics
    • Data Mining vs Text Mining
    • Data Science vs Artificial Intelligence
    • Data science vs Business intelligence
    • Data Science Vs Data Engineering
    • Data Science vs Data Visualization
    • Data Science vs Software Engineering
    • Data Scientist vs Big Data
    • Data Scientist vs Business Analyst
    • Data Scientist vs Data Engineer
    • Data Scientist vs Data Mining
    • Data Scientist vs Machine Learning
    • Data Scientist vs Software Engineer
    • Data visualisation vs Data analytics
    • Data vs Information
    • Data Warehouse vs Data Mart
    • Data Warehouse vs Database
    • Data Warehouse vs Hadoop
    • Data Warehousing VS Data Mining
    • DBMS vs RDBMS
    • Deep Learning vs Machine learning
    • Digital Analytics vs Digital Marketing
    • Digital Ocean vs AWS
    • DOS vs Windows
    • ETL vs ELT
    • Small Data Vs Big Data
    • Apache Hadoop vs Apache Storm
    • Hadoop vs HBase
    • Between Data Science vs Web Development
    • Hadoop vs MapReduce
    • Hadoop Vs SQL
    • Google Analytics vs Mixpanel
    • Google Analytics Vs Piwik
    • Google Cloud vs AWS
    • Hadoop vs Apache Spark
    • Hadoop vs Cassandra
    • Hadoop vs Elasticsearch
    • Hadoop vs Hive
    • Hadoop vs MongoDB
    • HADOOP vs RDBMS
    • Hadoop vs Spark
    • Hadoop vs Splunk
    • Hadoop vs SQL Performance
    • Hadoop vs Teradata
    • HBase vs HDFS
    • Hive VS HUE
    • Hive vs Impala
    • JDBC vs ODBC
    • Kafka vs Kinesis
    • Kafka vs Spark
    • Cloud Computing vs Data Analytics
    • Data Mining Vs Data Analysis
    • Data Science vs Statistics
    • Big Data Vs Predictive Analytics
    • MapReduce vs Yarn
    • Hadoop vs Redshift
    • Looker vs Tableau
    • Machine Learning vs Artificial Intelligence
    • Machine Learning vs Neural Network
    • Machine Learning vs Predictive Analytics
    • Machine Learning vs Predictive Modelling
    • Machine Learning vs Statistics
    • MariaDB vs MySQL
    • Mathematica vs Matlab
    • Matlab vs Octave
    • MATLAB vs R
    • MongoDB vs Cassandra
    • MongoDB vs DynamoDB
    • MongoDB vs HBase
    • MongoDB vs Oracle
    • MongoDB vs Postgres
    • MongoDB vs PostgreSQL
    • MongoDB vs SQL
    • MongoDB vs SQL server
    • MS SQL vs MYSQL
    • MySQL vs MongoDB
    • MySQL vs MySQLi
    • MySQL vs NoSQL
    • MySQL vs SQL Server
    • MySQL vs SQLite
    • Neural Networks vs Deep Learning
    • PIG vs MapReduce
    • Pig vs Spark
    • PL SQL vs SQL
    • Power BI Dashboard vs Report
    • Power BI vs Excel
    • Power BI vs QlikView
    • Power BI vs SSRS
    • Power BI vs Tableau
    • Power BI vs Tableau vs Qlik
    • PowerShell vs Bash
    • PowerShell vs CMD
    • PowerShell vs Command Prompt
    • PowerShell vs Python
    • Predictive Analysis vs Forecasting
    • Predictive Analytics vs Data Mining
    • Predictive Analytics vs Data Science
    • Predictive Analytics vs Descriptive Analytics
    • Predictive Analytics vs Statistics
    • Predictive Modeling vs Predictive Analytics
    • Private Cloud vs Public Cloud
    • Regression vs ANOVA
    • Regression vs Classification
    • ROLAP vs MOLAP
    • ROLAP vs MOLAP vs HOLAP
    • Spark SQL vs Presto
    • Splunk vs Elastic Search
    • Splunk vs Nagios
    • Splunk vs Spark
    • Splunk vs Tableau
    • Spring Cloud vs Spring Boot
    • Spring vs Hibernate
    • Spring vs Spring Boot
    • Spring vs Struts
    • SQL Server vs PostgreSQL
    • Sqoop vs Flume
    • Statistics vs Machine learning
    • Supervised Learning vs Deep Learning
    • Supervised Learning vs Reinforcement Learning
    • Supervised Learning vs Unsupervised Learning
    • Tableau vs Domo
    • Tableau vs Microstrategy
    • Tableau vs Power BI vs QlikView
    • Tableau vs QlikView
    • Tableau vs Spotfire
    • Talend Vs Informatica PowerCenter
    • Talend vs Mulesoft
    • Talend vs Pentaho
    • Talend vs SSIS
    • TensorFlow vs Caffe
    • Tensorflow vs Pytorch
    • TensorFlow vs Spark
    • TeraData vs Oracle
    • Text Mining vs Natural Language Processing
    • Text Mining vs Text Analytics
    • Cloud Computing vs Virtualization
    • Unit Test vs Integration Test?
    • Universal analytics vs Google Analytics
    • Visual Analytics vs Tableau
    • R vs Python
    • R vs SPSS
    • Star Schema vs Snowflake Schema
    • DDL vs DML
    • R vs R Squared
    • ActiveMQ vs Kafka
    • TDM vs FDM
    • Linear Regression vs Logistic Regression
    • Slf4j vs Log4j
    • Redis vs Kafka
    • Travis vs Jenkins
    • Fact Table vs Dimension Table
    • OLTP vs OLAP
    • Openstack vs Virtualization
    • Cluster v/s Factor analysis
    • Informatica vs Datastage
    • CCBA vs CBAP
    • SPSS vs EXCEL
    • Excel vs Tableau
    • Cassandra vs MySQL
    • RabbitMQ vs Kafka
    • SAAS vs Cloud
    • RabbitMQ vs Redis
    • AMQP vs MQTT
    • Forward Chaining vs Backward Chaining
    • Google Data Studio vs Tableau
    • ActiveMQ vs RabbitMQ
    • Cloud vs Data Center
    • Cores vs Threads
    • Inner Join vs Outer Join
    • ZeroMQ vs Kafka
    • Mxnet vs TensorFlow
    • Redis vs Memcached
    • RDBMS vs NoSQL
    • AWS Direct Connect vs VPN
    • Cassandra vs Couchbase
    • Elegoo vs Arduino
    • Redis vs MongoDB
    • Chef vs Puppet
    • GSM vs GPRS
    • Keras vs TensorFlow vs PyTorch
    • Cloudflare vs CloudFront
    • Bitmap vs Vector
    • Left Join vs Right Join
    • IaaS vs PaaS
    • Blue Prism vs UiPath
    • GNSS vs GPS
    • Cloudflare vs Akamai
    • GCP vs AWS vs Azure
    • Arduino Mega vs Uno
    • Qualitative vs Quantitative Data
    • Arduino Micro vs Nano
    • PIC vs Arduino
    • PRTG vs Solarwinds
    • PostgreSQL vs SQLite
    • Metabase vs Tableau
    • Arduino Leonardo vs Uno
    • Arduino Due vs Mega
    • ETL Vs Database Testing
    • DBMS vs File System
    • CouchDB vs MongoDB
    • Arduino Nano vs Mini
    • IaaS vs PaaS vs SaaS
    • On-premise vs off-premise
    • Couchbase vs CouchDB
    • Tableau Dimension vs Measure
    • Cognos vs Tableau
    • Data vs Metadata
    • RethinkDB vs MongoDB
    • Cloudera vs Snowflake
    • HBase vs Cassandra
    • Business Analytics vs Business Intelligence
    • R Programming vs Python
    • MongoDB vs Hadoop
    • MySQL vs Oracle
    • OData vs GraphQL
    • Soft Computing vs Hard Computing
    • Binary Tree vs Binary Search Tree
    • Datadog vs CloudWatch
    • B tree vs Binary tree
    • Cloudera vs Hortonworks
    • DevSecOps vs DevOps
    • PostgreSQL Varchar vs Text
    • PostgreSQL Database vs schema
    • MapReduce vs spark
    • Hypervisor vs Docker
    • SciLab vs Octave
    • DocumentDB vs DynamoDB
    • PostgreSQL union vs union all
    • OrientDB vs Neo4j
    • Data visualization vs Business Intelligence
    • QlikView vs Qlik Sense
    • Neo4j vs MongoDB
    • Postgres Schema vs Database
    • Mxnet vs Pytorch
    • Naive Bayes vs Logistic Regression
    • Random Forest vs Decision Tree
    • Random Forest vs XGBoost
    • DynamoDB vs Cassandra
    • Looker vs Power BI
    • PostgreSQL vs RedShift
    • Presto vs Hive
    • Random forest vs Gradient boosting
    • Gradient boosting vs AdaBoost
    • Amazon rds vs Redshift
    • Bigquery vs Bigtable
    • Data Architect vs Data Engineer
    • DataSet vs DataTable
    • dataset vs dataframe
    • Dataset vs Database
    • New Relic vs Splunk
    • Data Architect and Management Designer
    • Data Engineer vs Data Analyst
    • Grafana vs Tableau
    • MySQL text vs Varchar
    • Relational Database vs Flat File
    • Datadog vs Prometheus
    • Neo4j vs Neptune
    • Data Mining vs Data warehousing
    • DocumentDB vs MongoDB
    • PostScript vs PCL
    • QRadar vs Splunk
    • Qlik Sense vs Tableau
    • DigitalOcean vs Google Cloud
    • PostgreSQL vs Elasticsearch
    • Redshift vs blueshift
    • Gitlab vs Azure DevOps

Related Courses

Online Data Science Course

Online Tableau Training

Azure Training Course

Hadoop Certification Course

Data Visualization Courses

All in One Data Science Course

Tableau vs Power BI vs QlikView

By Priya PedamkarPriya Pedamkar

Tableau vs Power BI vs QlikView

Difference Between Tableau vs Power BI vs QlikView

In the article Tableau vs Power BI vs QlikView, a BI tool acts as a ready-to-use option to facilitate quick insight generation for effective decision making. With multiple BI and Analytics tools available in the market, the choice of a tool is governed by various factors such as the preference of organization, level of technical expertise of employees, budget, etc. At surface level, all tools may seem to be providing similar functionalities but studying them closely allows us to know that there exist fine distinctions that form their core competencies. The tools are updated continuously to overcome identified shortcomings or limitations and to incorporate new features.

Head to Head Comparison between Tableau vs Power BI vs QlikView (Infographics)

Below are the top 13 Comparisons between Tableau and Power BI and QlikView:

Tableau vs Power BI vs QlikView info

Key Differences between Tableau vs Power BI vs QlikView

Let’s discuss the top comparison between Tableau and Power BI and QlikView:

Start Your Free Data Science Course

Hadoop, Data Science, Statistics & others

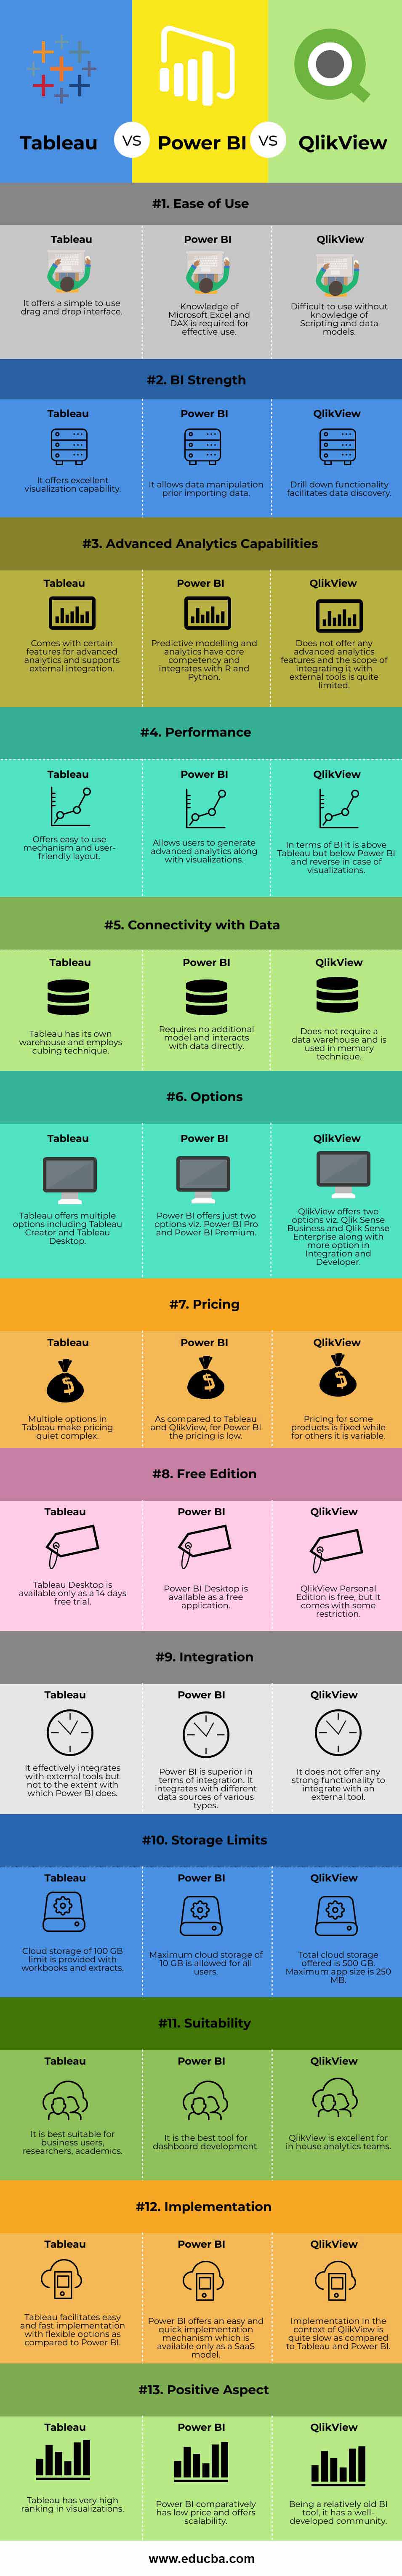
  1. The use of Tableau doesn’t require any prior technical knowledge. The simple drag-and-drop interface makes this possible. As against this, Power BI, for effective use, requires knowledge of Excel and DAX (Data Analysis and Expression). QlikView is difficult to work upon as scripting knowledge and familiarity with data modeling is a must.
  2. Tableau is a pure visualization tool. If the sole purpose is to generate visualizations for analysis, then Tableau best serves the purpose. Power BI is not just a visualization tool, as it also offers excellent predictive modeling and BI capabilities. QlikView’s unique characteristic is its drill-down functionality that let’s incorporate insights from data discovery in visual analytics.
  3. Tableau offers certain in-built features for advanced analytics, like time series modeling. It also supports integration with an external tool. However, when it comes to advanced analytics, Power BI surpasses the remaining BI tools. QlikView, on the other hand, fails to match the two tools on this parameter.
  4. In terms of performance, the simple user-interface of Tableau enables fast development. Power BI, though being comparatively new, offers seamless options to generate a variety of advanced analytics and so in terms of performance as a BI tool has quickly established itself as the most preferred tool. QlikView, in terms of BI, ranks above Tableau but below Power BI, and reverse in the context of visualizations.
  5. In the context of data connectivity and extraction, Tableau employs the cubing technique and has its data warehouse. Power BI requires no additional model thus establishing a direct connection with data. QlikView works on the principle of in-memory technique to work with data.
  6. Tableau offers various options based on user requirements. It has a tremendous user base and so this has led it to come up with a variety of options. Pricing differs based on edition, and the pricing structure is complex. Power BI offers only two options viz. Power BI Pro and Power BI Premium. The pricing is comparatively low for Power BI. QlikView is comparatively an old tool and it mainly offers two options for small businesses and large enterprises. The pricing is fixed for certain editions while for others it is variable as decided by the sales.
  7. Tableau effectively integrates with external statistical packages like R, and the visualizations could be used incorporated in the tool. Power BI, however, is the best tool for integration and leaves behind Tableau too. It integrates with numerous external sources like MS Excel, XML, JSON, SQL, Google Analytics, Marketo, Facebook, Hadoop, R, Spark, Python, etc. QlikView is weak in terms of integration as compared to Tableau and Power BI.
  8. Tableau is best suitable for users who need a BI tool in their domain work, e.g. researchers. Power BI is excellent for dashboard development as it incorporates several features of advanced statistical and visual analytics capabilities. QlikView allows sharing of analysis, and its data discovery functionality best suits internal teams of large enterprises.
  9. Speaking about each tool’s advantage, Tableau offers superb visual capabilities than any other BI tool. Power BI along with offering various features is available at a comparatively low price. QlikView has a well-developed community that has resulted in its high rating.

Comparison Table of Tableau vs Power BI vs QlikView

The table below summarizes the comparisons between Tableau and Power BI and QlikView:

Criteria Tableau Power BI QlikView
Ease of Use It offers a simple to use drag and drop interface. Knowledge of Microsoft Excel and DAX is required for effective use. Difficult to use without knowledge of Scripting and data models
BI Strength It offers excellent visualization capability. It allows data manipulation prior importing data. The drill-down functionality that facilitates data discovery
Advanced Analytics Capabilities Comes with certain features for advanced analytics and supports external integration Predictive modeling and analytics are core competencies and integrates with R and Python. It doesn’t offer any advanced analytics features and the scope of integrating it with external tools is quite limited.
Performance Offers easy-to-use mechanism and user-friendly layout. It allows users to generate advanced analytics along with visualizations. In terms of BI, it is above Tableau but below Power BI and reverse in case of visualizations.
Connectivity with Data Tableau has its warehouse and employs cubing technique. It requires no additional model and interacts with data directly. It does not require a data warehouse and uses the in-memory technique.
Options Tableau offers multiple options, including Tableau Creator and Tableau Desktop. Power BI offers just two options viz. Power BI Pro and Power BI Premium. QlikView offers two options viz. Qlik Sense Business and Qlik Sense Enterprise along with more options in Integration and Developer.
Pricing Multiple options in Tableau make pricing quiet complex. As compared to Tableau and QlikView, for Power BI, the pricing is low. Pricing for some products is fixed while for others, it is variable.
Free Edition Tableau Desktop is available only as a 14 days free trial. Power BI Desktop is available as a free application. QlikView Personal Edition is free but comes with some restrictions.
Integration It effectively integrates with external tools but not to the extent with which Power BI does. Power BI is superior in terms of integration. It integrates with different data sources of various types. It doesn’t offer any strong functionality to integrate with an external tool.
Storage Limits Cloud storage of 100 GB limit is provided workbooks and extracts. A maximum cloud storage of 10 GB is allowed for all users. The total cloud storage offered is 500 GB. The maximum app size is 250 MB.
Suitability It is best suitable for business users, researchers, academics. It is the best tool for dashboard development. QlikView is excellent for in house analytics teams.
Implementation Tableau facilitates easy and fast implementation with flexible options as compared to Power BI. Power BI though offering an easy and quick implementation mechanism is available only as a SaaS model. Implementation in the context of QlikView is quite slow as compared to Tableau and Power BI.
Positive Aspect Tableau has a very high ranking in visualizations. Power BI comparatively has a low price and offers scalability. Being a relatively old BI tool, it has a well-developed community.

Conclusion

Tableau, Power BI and QlikView are all-powerful BI tools. Each of them excels at certain parameters. The tools are constantly updated based on competitor tool assessment and user requirements. Each of the tools has a unique selling proposition that keeps attached a user baser base and attracts similar users.

Recommended Articles

This is a guide to the top difference between Tableau vs Power BI vs QlikView. Here we also discuss the key differences with infographics and comparison tables. You may also have a look at the following articles to learn more –

  1. Perl vs Python – Top Differences
  2. Uses of Tableau | Top 10 Uses
  3. Abstraction vs Encapsulation | Top 6 Comparison  
  4. Introduction to Power Bi Interview Questions
  5. How to Use Calendar DAX Function in Power BI?
  6. How to Use Filter DAX Function in Power BI?
Popular Course in this category
Tableau Training (8 Courses, 8+ Projects)
  8 Online Courses |  8 Hands-on Projects |  55+ Hours |  Verifiable Certificate of Completion
4.5
Price

View Course

Related Courses

Data Scientist Training (85 Courses, 67+ Projects)4.9
Azure Training (6 Courses, 5 Projects, 4 Quizzes)4.8
Hadoop Training Program (20 Courses, 14+ Projects, 4 Quizzes)4.7
Data Visualization Training (15 Courses, 5+ Projects)4.7
All in One Data Science Bundle (360+ Courses, 50+ projects)4.7
0 Shares
Share
Tweet
Share
Primary Sidebar
Footer
About Us
  • Blog
  • Who is EDUCBA?
  • Sign Up
  • Live Classes
  • Corporate Training
  • Certificate from Top Institutions
  • Contact Us
  • Verifiable Certificate
  • Reviews
  • Terms and Conditions
  • Privacy Policy
  •  
Apps
  • iPhone & iPad
  • Android
Resources
  • Free Courses
  • Database Management
  • Machine Learning
  • All Tutorials
Certification Courses
  • All Courses
  • Data Science Course - All in One Bundle
  • Machine Learning Course
  • Hadoop Certification Training
  • Cloud Computing Training Course
  • R Programming Course
  • AWS Training Course
  • SAS Training Course

ISO 10004:2018 & ISO 9001:2015 Certified

© 2022 - EDUCBA. ALL RIGHTS RESERVED. THE CERTIFICATION NAMES ARE THE TRADEMARKS OF THEIR RESPECTIVE OWNERS.

EDUCBA
Free Data Science Course

SPSS, Data visualization with Python, Matplotlib Library, Seaborn Package

*Please provide your correct email id. Login details for this Free course will be emailed to you

By signing up, you agree to our Terms of Use and Privacy Policy.

EDUCBA Login

Forgot Password?

By signing up, you agree to our Terms of Use and Privacy Policy.

EDUCBA
Free Data Science Course

Hadoop, Data Science, Statistics & others

*Please provide your correct email id. Login details for this Free course will be emailed to you

By signing up, you agree to our Terms of Use and Privacy Policy.

EDUCBA

*Please provide your correct email id. Login details for this Free course will be emailed to you

By signing up, you agree to our Terms of Use and Privacy Policy.

Let’s Get Started

By signing up, you agree to our Terms of Use and Privacy Policy.

This website or its third-party tools use cookies, which are necessary to its functioning and required to achieve the purposes illustrated in the cookie policy. By closing this banner, scrolling this page, clicking a link or continuing to browse otherwise, you agree to our Privacy Policy

Loading . . .
Quiz
Question:

Answer:

Quiz Result
Total QuestionsCorrect AnswersWrong AnswersPercentage

Explore 1000+ varieties of Mock tests View more