Updated June 15, 2023

Overviews of Tableau Dashboard (Examples)
Tableau is a Business Intelligence tool that is used to analyze data visually. Anyone can develop and provide an interactive and shareable dashboard; variations with Tableau, Tableau depict the trends and density of the data in the form of various forms like charts and graphs. The software allows data to be depicted on various charts and graphs, which makes it very unique and important. It can be connected to files and Big Data sources to acquire and process data to show on the chart. It can be used by academic researchers, businesses, and many government organizations for visual data analysis and creating reports. It has taken as a leader in Analytics Platform and Business Intelligence in Gartner Magic Quadrant.
Features of Tableau Dashboard
The important features in Tableau Dashboard are as follows:
Real-Time Collaboration –Tableau can sort, filter discuss data on the fly, and embed it on live dashboard portals like Salesforce and SharePoint sites.
Self-Reliant –To run Tableau does not require a complex software setup.
Centralized Data – The server of Tableau provides a centralized location to manage all published data by all organizations.
The speed of Analysis –To work with Tableau does not require programming knowledge. The user just needs to access data to derive value.
Main Concept of Tableau Dashboard
Setup Steps on Windows –
- Download the Free Personal Edition of Tableau Desktop from the link-https://www.tableau.com/products/desktop/download?os=windows. To download the software, we need to provide the required details during the download.
- Install the downloaded software by accepting the term and conditions
- After installation, it will prompt the few options we have to choose to start the trial now if you are using it only for learning purposes.
- After, it will ask for your name and many details to provide all the mandatory information needed to proceed further.
- Verify installation by going to the Start menu of the window, Tableau icon will come in search.
How to create Tableau Data reports
- Connect to a Data Source– First, we have to give the source of the data source from where data is to bed fetched.
- Choose the Dimensions and Measures – Give the dimension and measures for the data.
- Apply Visualization Technique– Apply the visualization on the data to show on the chart.
Menu Commands of Tableau Dashboard
1) File Menu
The file menu is used to create a new Tableau workbook and open existing workbooks from both the local system and Tableau server. Below are a few of them.
- Workbook Locale is used to set the language to be used in the report.
- Paste Sheets pastes a sheet into the current workbook, which is copied from another workbook.
- Export Packaged Workbook is used to create a packaged workbook, which will be shared with other users.
2) Data Menu
The data menu is used to create a new data source to fetch the data for analysis and visualization. It also allows you to replace or upgrade the existing data source. The important features in the Data menu are as follows:−
- New Data Source is used to view all the types of connections available and choose from them.
- Refresh All Extracts refreshes the data from the source.
- Edit Relationships This defines the fields in more than one data source for linking.
3) Worksheet Menu
This menu is used to create a new worksheet along with various display features, such as showing the title and captions. The important features in the Worksheet menu are as follows −
- Show Summary it allows to view the summary of the data used in the worksheet, such as count, etc.
- The tooltip is used to show the tooltip when hovering above various data fields.
- Run Update This option updates the worksheet data or filters used.
4) Dashboard Menu
The dashboard menu is used to create a new dashboard along with various display features, such as showing the title and exporting the image, etc. The important features in the Dashboard menu are as follows –
- The format used to set the layout in terms of colors and sections of the dashboard.
- Actions it is used to link the dashboard sheets to external URLs or other sheets.
- The Export Image option exports an image of the Dashboard.
5) Story Menu
The story menu is used to create a new story that has many sheets or dashboards with related data. The important features of this menu are as follows −
- Format sets the layout in terms of colors and sections of the story.
- Run Update updates the story with the latest data from the source.
- Export Image is used to export an image of the story.
6) Analysis of Menu
The analysis menu is used for analyzing the data present in the sheet. Tableau provides many out-of-the-box features, such as calculating the percentage and performing a forecast, etc. The important features in the Analysis menu are as follows −
- Forecast– It is issued to show a forecast based on available data.
- Trend Lines show the trend line for a series of data.
- Create a Calculated Field option that creates additional fields based on certain calculations on the existing fields.
7) Map Menu
The map menu is used for building map views in Tableau. You can assign geographic roles to fields in your data. The important features in the Map menu are as follows −
- Map Layers-It is used to hide and show map layers, such as street names and country borders, and adds data layers.
- Geocoding creates new geographic roles and assigns them to the geographic fields in your data.
8) Format Menu
Format menu is used for applying the various formatting options to enhance the look and feel of the dashboards created. It provides features such as borders, colors, alignment of text, etc. The important features in the Format menu are as follows −
- Borders apply borders to the fields displayed in the report.
- Title & Caption is used to assign a title and caption to the reports.
- Cell Size customizes the size of the cells displaying the data.
- Workbook Theme applies a theme to the entire workbook.
9) Server Menu
The important features in the Server menu are as follows −
- Publish Workbook publishes the workbook in the server to be used by others.
- Publish Data Source publishes the source data used in the workbook.
- Create User Filters creates filters on the worksheet to be applied by various users while accessing the report.
Tableau Dashboard Examples
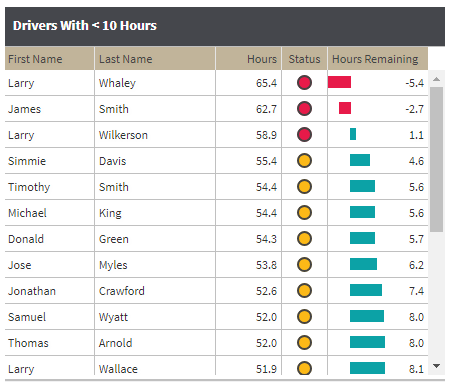
Source link -https://samples.dundas.com/Dashboard/57a4b3e9-0942-41da-8254-a80fd0da24b4?e=false&vo=viewonly
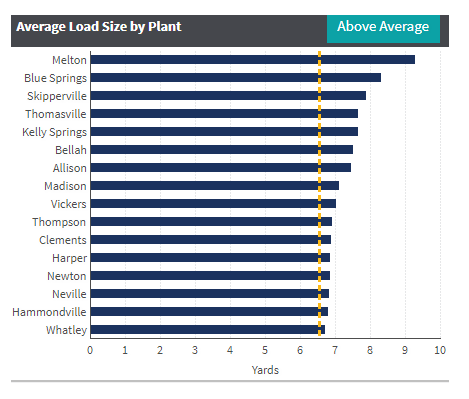
Source link -https://samples.dundas.com/Dashboard/57a4b3e9-0942-41da-8254-a80fd0da24b4?e=false&vo=viewonly
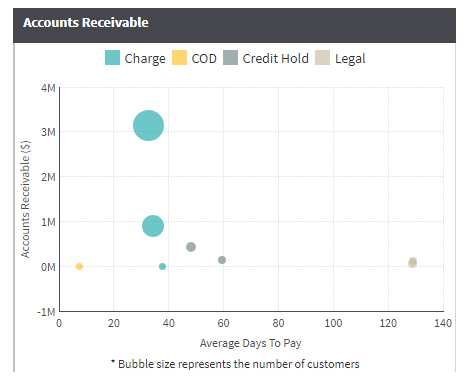
Source link -https://samples.dundas.com/Dashboard/57a4b3e9-0942-41da-8254-a80fd0da24b4?e=false&vo=viewonly
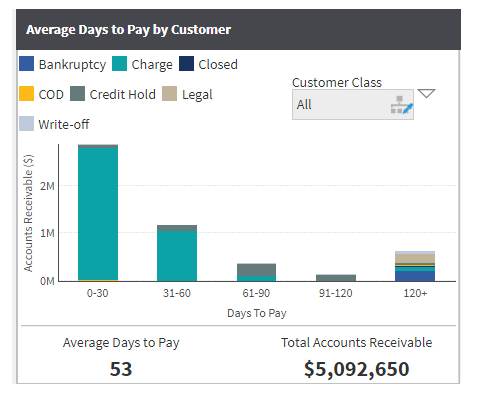
Source link – https://samples.dundas.com/Dashboard/386836d8-7be2-4c21-bb47-67eec50dac0b?e=false&vo=viewonly
Conclusion
As we saw, we can create a report with Tableau, It provides lots of ways to create the report, which helps our business to improve the performance of the company.
Recommended Articles:
This has been a guide to Tableau Dashboard. Here we have discussed the Different methods of Tableau Dashboard with examples. You may also look at the following article to learn more –
