Updated October 26, 2023
Introduction to Stock Market Chart Patterns
This article provides detailed insight into stock market chart patterns. Financial management is one of the most important aspects of successfully using resources. But money does not grow on trees. You need to be clear about the basics before delving into the market. Wondering just what a futures contract is? Or what trading in derivatives is all about? Read on to learn about futures fundamentals and the basic types of financial chart patterns that will equip you in the money market.
Stock Market Chart Patterns Futures Contract: Looking into the Financial Crystal Ball
A futures contract is a type of derivative instrument. It is a financial contract where the buyer and seller agree to transact financial instruments/commodities for delivery at a certain price in the future.
Buying a futures contract = Buying something the seller has not produced yet
Why do buyers agree to buy something that has not been produced?
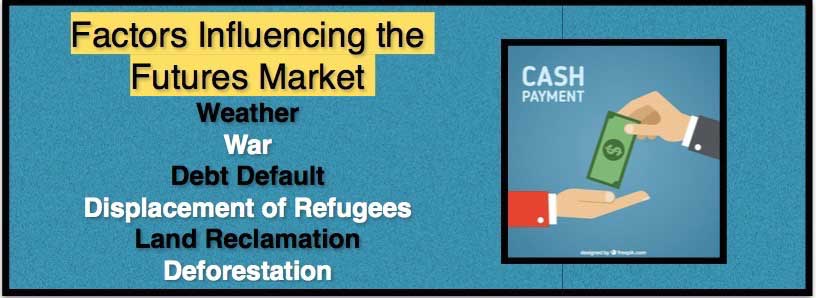
The futures market is based on speculation. This means buyers and sellers are entering into a contract to hedge risk. The futures market is different from the cash or spot market.
Futures function as financial instruments by speculators. In contrast, the cash or spot market only involves producers and consumers.
Characteristics of the futures market:
- Extremely liquid
- Risky/high risk
- Complex in nature

Golden Rule: Stock Market Chart Patterns are not for the risk-averse.
The futures market is a centralized marketplace for sellers and buyers across the globe. The futures contract states the price to be paid and the delivery date.
Most futures contracts end without actual delivery of the commodity.
Example of a futures contract: Buyer makes a contract to receive product A at a later date. Price and terms for delivery are established. This means the price for product A has been secured for a certain period in the future. This has its advantages if the price of the product rises in the near future. By forming an agreement, the buyer is reducing the risk of prices shooting up.
Stock Market Chart Patterns Futures Contract- The Long and Short of It
A futures contract is an agreement between a party agreeing to deliver the commodity (short position) and a long position (party agreeing to receive the commodity).
So, what does the profit and loss of a stock market futures definition contract depend on? The daily movement of the market futures decides how much money you will make (or lose).
Unlike stock market chart patterns, futures definition positions are settled daily. Gains and losses from trading within the day are deducted/added to the account daily.
Most transactions in this type of market are settled on an everyday basis. In the stock market futures definition, capital gains or losses from price movement are not realized until the investor decides to sell the stock or cover the short position.
Most transactions in the futures market are cash settlements because accounts have to be adjusted daily.
Prices in the cash and futures markets move in tandem with each other. Following the expiry of the futures contract, prices merge into one. The contract settles on the day either party decides to close their position.
The Stock Market Chart Patterns Fine Art of Hedging
- Losses in the stock market futures, meaning contracts, are offset by the higher selling price within the cash market or hedging.
- The futures market is active and the key to catching the pulse of the global marketplace. It offers important information about the market sentiments.
- The futures market has become a critically important tool for assessing prices based on an estimate of supply and demand. The futures market is transparent and based on information from around the world.
Price Discovery: This refers to how the type of information and how people absorb it constantly changes the prices of the commodity.
Risk Reduction: Risk is reduced in the futures market as the price is pre-set, letting buyers and sellers know and reducing the cost for the retail buyer.
This is because less risk = equals less chance of manufacturers increasing prices to compensate for profit/loss in the cash market.
Two players in the futures market = Hedgers and Speculators
Hedger buys or sells in the futures market to secure the future price of the commodity sold later in the cash market. This guards against price risk.
Holders of the long position will try to get the lowest price possible. Short holders will aim for the highest price possible. While long position holders are the buyers of the commodity futures, short holders of the contract will be the sellers.
A futures contract provides for definite pricing, thereby reducing risks linked with price volatility. Hedging through the stock market futures means the contract can help secure the wanted price margin between the raw material’s cost and the retail cost of its final product.
The Speculator Versus the Hedger
 Other participants in the market benefit from the risky nature of the futures market. These are speculators, and they benefit from the price change the hedgers want to avoid.
Risk avoiders= Hedgers
Risk takers=Speculator
Hedgers want to minimize risk; speculators want to maximize it. In the future, speculators purchase a contract low to sell high ahead, while hedgers sell low, thinking the price will fall.
Speculators do not seek to own the commodity, while hedgers do.
| Short | Long | |
| The Hedger | Guard against declining prices in the future by securing a price | Guard against future rising prices by securing a price |
| The Speculator | Secure a price now, thinking prices will fall | Secure a price now, believing prices will rise |
The market is fast-paced. Information is continuously being fed, and speculators, as well as hedgers, benefit from each other. When the contract’s expiry nears, more solid information about the commodity in question reaches the market.
A futures contract aims to predict the future value of an index/commodity. There are three strategies available for the trader in the stock market futures:
Going Long: Benefiting from the possibility of a future price increase
Going Short: Making a profit from falling price levels
Both are going long and short and involve the purchase or sale of the contract to benefit from rising or falling prices n the future.
Spreads – Benefiting from the price difference between two varying contracts of a single commodity. This is a conservative form of stock market futures, i.e., trading because it is safer than the other options.
| Types of Spreads | Definition |
| Calendar | Buying and selling two futures at the same time of the same type at a similar price but differing dates of delivery |
| Inter-market | Investor goes long in one market and short in another |
| Interexchange | Investor creates a position in different futures exchanges |
The Basic Premise: Risk is all around you. Risk can be a threat or an opportunity depending on which side of the stock market futures, i.e., the contract you are on.
Futures exchanges provide markets for all kinds of commodities trading, and they are the leading forum for sale and purchase.
The aim is to remove risk from business or earn money as investors when there is a price fluctuation. No one knows the future. Derivatives such as futures and options can help protect goals, even if the prices are moving in an unwanted direction.
The Ins and Outs of Futures
- Derivative Financial instrument deriving value from the price movement of another instrument
- Changes in instruments tracked by the derivative bring about changes in the price of the derivative.
- Futures are one of the oldest derivatives contracts. They were initially designed to help farmers hedge against price changes in crops. Therefore, many stock market futures chart contracts revolve around agrarian items like livestock and grains.
- The futures market has also expanded to include contracts linked with numerous assets such as precious metals, industrial metals, energy, bonds, and stocks.
Futures Versus Other Financial Instruments
- The value of the futures contract differs based on the movement of another value.
- Futures have finite held life.
- The futures contract has a set expiry date, and the contract ceases to exist after this.
- Market direction and timing are of critical importance in the futures market.
- Futures also use leverage.
What is Leverage?
- Investors must make small payments to initiate a position while buying or selling a stock market futures chart contract. This is called leverage. So, the investor need not pay for the entire contract at the time of trade initiation.
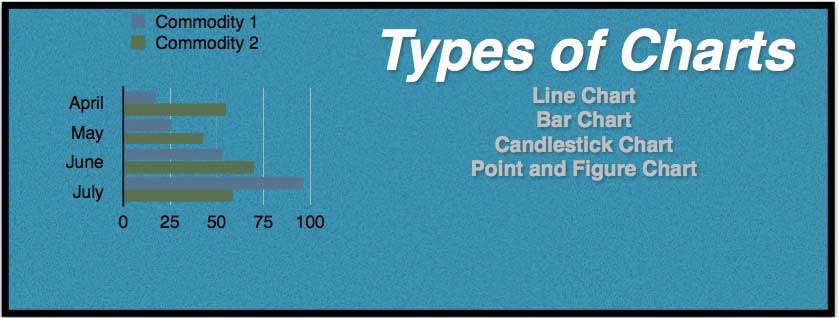
- Measuring the Market: Technical Analysis through 4 Basic Charts
- Four main kinds of charts are used by investors plus traders based on the information sought and individual skill levels.

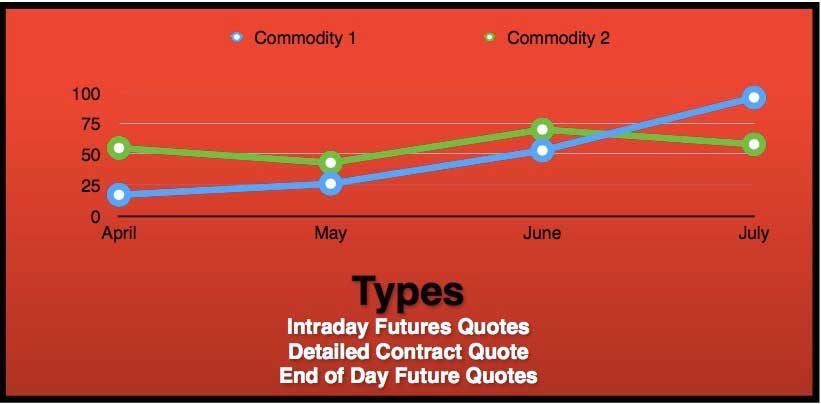
Line Chart
- Most basic of the 4 charts.
- Represents closing prices over the set period.
- A line forms by connecting closing prices over some time.
- Line charts do not give visual information on the trading range for points such as high, low, and opening prices.
Closing price = most important price/only value in line charts
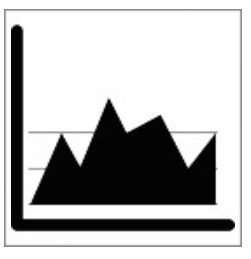
Bar Charts
- Expand the line chart by adding information for each data point.
- The chart comprises a series of vertical lines for each data point.
- The red bar signals stock prices have gone down,/and the black bar signals the opposite.
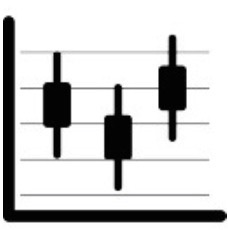
Candlestick Chart
Similar to the bar chart, the candlestick chart has a thin vertical line showing the commodity trading range of the period.
The formation of a wide bar on the vertical line shows the difference between open and closed.
When the stock price is up, the candlestick is white clear/in case the stock has traded down for the period. The candlestick will be red or black.
Point and Figure Charts
Not as well known to the average investor, it dates back to the start of technical analysis.
Reflects price movement and is uninvolved with time and volume in formulating points
Types of Chart Patterns in Stock Market Chart Patterns
Ascending Triangle Stock Market Chart Patterns
- Bullish futures pattern
- Resistance remains flat while support rises
- What it means- Price will rise and fall within the triangle until support and resistance converge. The apex of the breakout usually occurs upwards.
Broadening Top Futures Trading Stock Market Chart Patterns
- This is a futures chart pattern occurring on an upward trend
- Opposite of a symmetrical triangle
Most Common Stock Market Chart Patterns
Heads and Shoulders Stock Market Chart Patterns
A reversal pattern indicates security will move against the previous trend
Two types are there:
- Heads and shoulders top: Indicates security price will lower once the pattern is completed.
- Heads and shoulders bottom/inverse head and shoulders: Security prices will rise.
While the former forms an upward trend, the latter forms a downward trend.
If security moves in the direction opposite to a trend indicated by the pattern, a fresh level of support/resistance strengthens the pattern in terms of its new direction.
Cup and Handle Pattern

- It is called so because it resembles a tea cup’s shape on the chart
- This continuation pattern is observed if a pure upward trend and trading has taken a downturn. Still, it will continue in the upward direction following pattern completion.
- This pattern is usually preceded by an upward move that stalls and sells off.
- Depending upon market volatility, the cup and handle pattern is between 1/3rd to 2/3rd the size of the preceding upwards movement.
- During the downward movement of the handle, a descending trend is created, forming the signal for a breakout.
Double Top and Bottom
- These are two other well-known Stock Market Chart Patterns.
- Two reversal patterns show the attempt to continue an existing trend.
- The double-top pattern is a clear sign the preceding upward trend is weakening, and there is a loss of interest among buyers.
- While using the double-top chart pattern, investors should wait for a price break below a certain support level before entering.
- The opposite chart pattern of the double top signals a reversal of the downtrend into an uptrend; the pattern is W-shaped.
Triangle
Forms the shape of the triangle
Two trend lines converge in this pattern, flat and ascending/descending. The price of the security moves between two trendiness.
Three types of triangles with varying insignificance can be formed: the symmetrical triangle, the descending triangle, and the ascending triangle.
- An asymmetrical triangle is a continuation pattern signaling consolidation in a trend followed by a carryover of the prior trend.
- A break should be below the ascending support line if a downward trend precedes the triangle.
- A break should be above the descending resistance line if an upward trend precedes the triangle.
- While the symmetrical pattern is high in the upward trend, later followed by a sell-off to a low, the ascending triangle is a bullish pattern, i.e., the sign that the price of a security will be higher on completion.
- The ascending triangle is formed by meeting two trend lines – a flat trend line being a point of resistance and an ascending trend line being the price support.
- The descending triangle is the converse of the ascending triangle as it gives a bearish indication, indicating that the price will trend downward following the completion of the pattern.
Flags and Pennants
- Continuation patterns closely match each other except during the consolidation period.
- While the flag is rectangular, the pennant looks more like a triangle. Both are formed following a sharp price movement and a sideways price movement (flag or pennant).
- Pattern completes when there is a price breakdown in the direction of the initial sharp price movement.
- The flag or pennant is flying at half-point, whereby the distance of the initial price movement is about equivalent to the price move before this. Patterns form after a large price movement as the market consolidates before taking on the initial trend.
- The flag is formed by parallel trend lines, supporting and resisting the price until the latter breaks out.
- The slope of the flag should be in the opposite direction of the current price movement.
- The flag should be downward sloping if the initial movement is up
- Pennant forms a symmetrical triangle whereby support and resistance trend lines meet at a point.
Wedge Chart Pattern – Stock Market Chart Patterns
This indicates the reverse of the trend formed within the wedge itself. Wedges have two trend lines: support and resistance, which band the security price.
Chart patterns wedge has converging trend lines slanting in an upward/downward direction
2 main types of wedges are rising and falling
The Gap
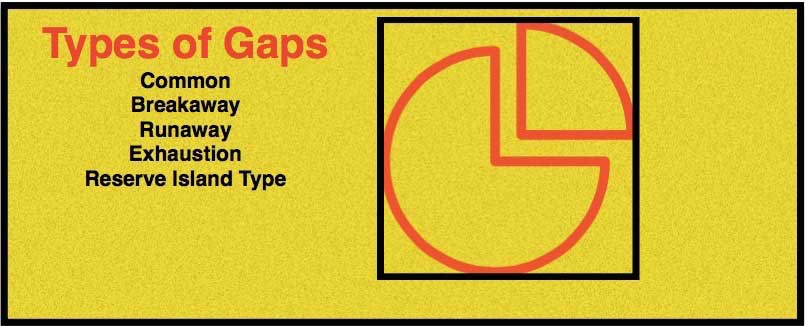
This is a space between two trading periods that affect security.
Gap price movements can be located on bar charts and candlestick charts
Triple Top and Triple Bottom
Triple top and bottom are reversal patterns that form when security aims to surpass the level of support or resistance in the current trend.
Rounding Bottom/ Saucer Bottom
Long-term reversal pattern showing a shift from a downtrend to an uptrend.
Conclusion
Money matters and futures trading is about beating the laws of supply and demand. Basic microeconomics forms the bulwark of complex trading systems. Managing money is an art and a science. Stock Market Futures charts trading is a step forward- it integrates basic financial principles with the prediction to produce a complex analysis that yields rich dividends.
(Image references– http://www.freepik.com/free-vector/)
Recommended Articles
So here are some articles that will help you to get more detail about the stock market chart patterns, stock market futures definition, stock market futures charts, and also stock market futures meaning, so just go through the link. which is given below.
