What is Statistical Analysis?
Statistical Analysis is the scientific way to collect, preprocess and apply a set of statistical methods to discover the insights or underlying pattern of the data. With the increase in cheap data and incremental bandwidth, we are now sitting on a ton of structured and unstructured data. Along with the need for acquiring and maintaining this huge data, one main challenge is to deal with the noise and convert the data into a meaningful way. The statistical analysis comes up with a set of statistical methodologies and tools to address the problem.
How Statistical Analysis is Performed?
Statistical analysis is a vast literature of data analysis itself. Let us discuss the most common approaches of statistical data analysis:
Searching for Central Tendency
While working with structural data it is often the preliminary step to get an idea on the central tendency of the data set. Suppose you are analyzing the salary data of an organization. Then you may be interested in the following questions like what is the average salary of a manager working in the organization for 3 years with so and so qualification? The following are used as a measurement of central tendency.
Mean: Mean is basically the average of all the data points. Mean is the total salary divided by the number of data points.

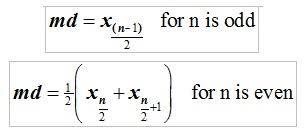
Median: Median is the 50th percentile of the data. When we are seeking information like average salary, the median will be a more robust measure. It is less sensitive to outliers.
Mode: Mode is the most frequent value in the list of numbers. Suppose we are dealing with a list of numbers [12, 33, 44, 55, 67, 55, 8, 55], here the mode with be 55.
Searching for Dispersion
Dispersion is the measurement of variability in the data. Dispersion helps us to find out how a data point is different from its central tendency. Finding the proper distribution is important to decide which machine learning algorithm to use based on the use case.
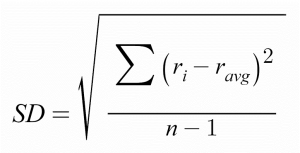
Standard Deviation: Standard Deviation quantifies how much the data point varies from its central tendency (dispersion). The lower the value, the more the data points are identical with its central value.
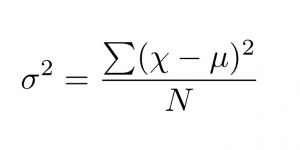
Variance: Variance is the square of standard deviation. The variance gives us the spread (variability) of the data. While working with high dimensional data we often come up with a situation where we need to reduce the dimensionality or analyze the important variables of the data set. In such situations, we convert the axis in such a way that maximum variability is preserved. This new rotating axis is called the principal components. We choose N important components (an axis with high variance) from the rotating components.
Interquartile Range (IQR): Interquartile range is the range of data between the 25th and 75th percentile values of the data set. We use box plot, violin plot, etc. to analyze the IQR in graphical ways.
Regression Problems
Regression is a set of problems where the independent variable is a continuous variable. For example, we have the historical sales data of car manufactures and various factors that affect the car manufacturing and sales process and we need to predict the sales of a particular brand. Now we will formulate the regression problem as ‘find the sales of a car brand ABC based on the factors x1, x2, x3, etc.’
Advantages of Using Statistical Analysis
Below are the points that explain the advantages of using Statistical Analysis:
- In the era of Big Data, while implementing any machine learning use case it is the utmost importance of how we choose the sample from the huge data lake. Statistical analysis helps us to determine the proper sampling methodology (i.e random, random without substitution, stratified sampling, etc) and reduce the sampling bias.
- For example, we are dealing with binary classification problem where 80% of data points belong to the class A and only 20% belong to class B. Now if we want to perform any statistical test with samples from the population, we must ensure the samples are also in 80:20 ratio (80% class A: 20% class B).
- Be it sampling or decision making the basis of statistical analysis is historical data. This makes statistical data analysis more acceptable as an industry-standard than another manual process of data analysis.
Why Do We Need Statistical Analysis?
The main goal of statistical analysis is to find valuable insights from the data which may be used to discover Industry trends, customer rate of attrition to a product or service, making a valuable business decision, etc.
From the collection of data to find the underlying patterns of the data, statistical analysis is the base of all data-driven methodologies and classical machine learning.
Scope of Statistical Analysis
The following are the points that explain the scope of Statistical Analysis:
- In today’s world, more and more Industries are switching to data-based decision-making systems instead of classical deterministic rule-based approaches.
- Statistical analysis is being used dominantly to solve various business problems across domains like Manufacturing, Insurance, Banking and Finances, Automobile, etc. from the industry point of view.
- From a technical perspective statistical analysis helps to solve linear regress, time series forecasting, predictive analysis, etc.
Conclusion
In this article, we have discussed the various aspects of statistical data analysis like methodologies, the need, and scope of use cases, etc. Statistical analysis is a very old area of study which lays out the base for modern machine learning and data-driven business models. The practical implementation of statistical analysis methodologies differs based on the type of use case and industry.
Recommended Articles
This is a guide to Statistical Analysis. Here we discuss what is Statistical Analysis, how it is performed? with the advantage and scope of statistical analysis. You can also go through our other related articles to learn more –

