Updated March 24, 2023
Introduction to Tooltips in Power BI
In this article, we will see an outline on Power BI Tooltips. Creating a chart in Power BI is an easy thing. Tooltips in many charts help us to get additional data labels apart from the values which are already there visual’s fields. But adding tooltips in that chart makes the view more detailed. Adding tooltips in any chart, makes that charts look more valuable without increasing additional columns, bars or lines on the charts. After adding tooltips, we just need to hover the cursor on the chart, we will be able to see the additional added field values there in the box.
How to Use Power BI Tooltips?
We do not have to go anywhere to find Tooltips unless we want to add a new Chart type into the visualization section. Once we create any chart we will be able to find the Tooltips there in the Fields section of Visualization.
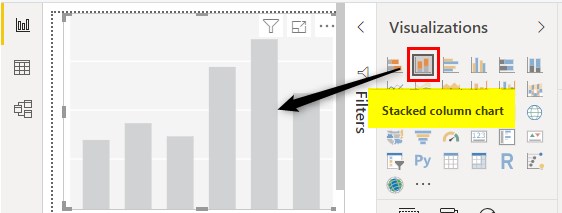
To see tooltips, first, we need to create a chart. Here we have select Stacked Column Chart from the list. Without selecting the data fields we will be able to see tooltips under Fields of the selected chart.
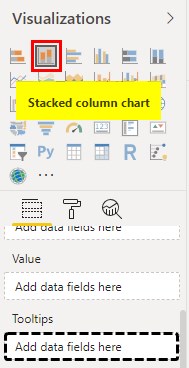
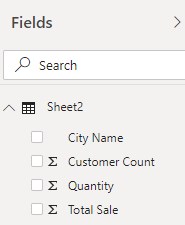
As we can see the description of Tooltips which says “Add data fields here”. We can add one or more than one data field here. You can also download the excel workbook from the below link which is used for this example.
Example #1
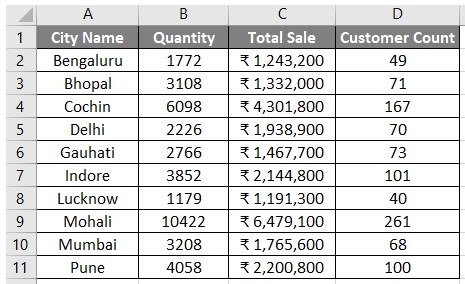
- We will use the sales data of electronics products and we will convert this data into a tabular form so that we could project some charts out it.
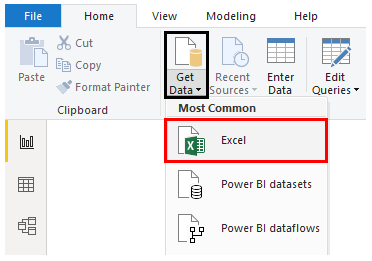
- Click on Get Data which is there in the Home menu ribbon in Power BI. Select the source file and upload it. Here our data is in Excel.
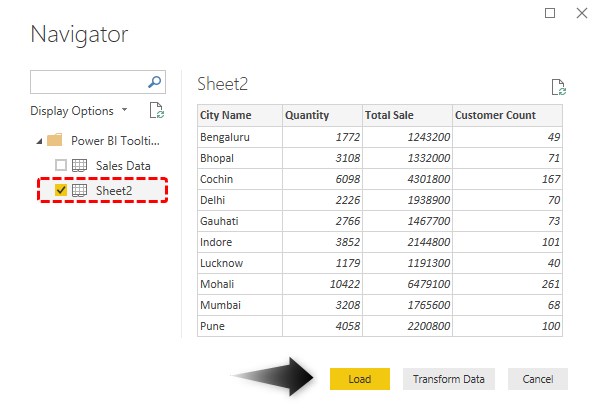
- Then browse the file location and open it. From the Navigator window, select the sheet which we want to Load. Here the summary of sales data is in Sheet2.
- We will see our data is now uploaded into the Power BI system.
- Once the data is upload, now we select the chart which you want to create. Here we are selecting a basic Stacked Column Chart which is most commonly used.
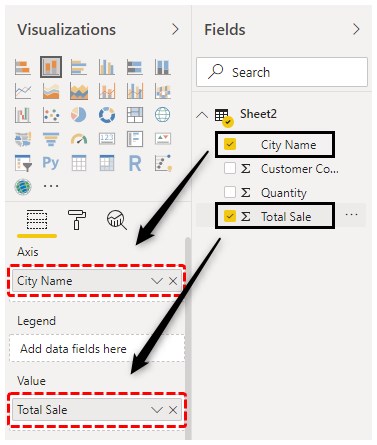
- Now drag the fields which we want to see. Here we are using City name in Axis and Total Sale in Value.
- We will get our basic Stacked Column Chart as shown below.
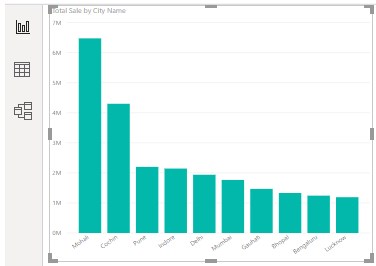
We can do the basic formatting such as border, data labels, column colors, etc. as needed.
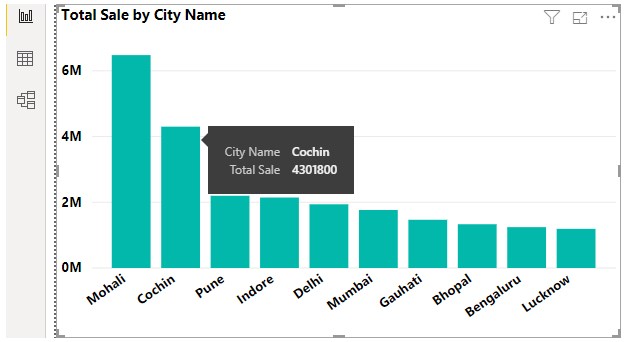
- Now if we, however, move the cursor on any of the columns in the created chart we will be able to see only City Name and Total Sale which we have used while creating this chart.
What if we want to see the other values as well apart from these selected 2 values? This is only possible using Tooltips function which is only available in Power BI. This type of function is not available in Excel, even though it has most of the features which we do for creating charts.
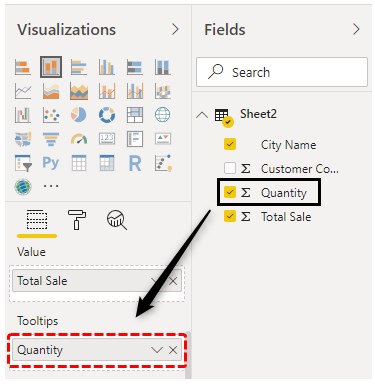
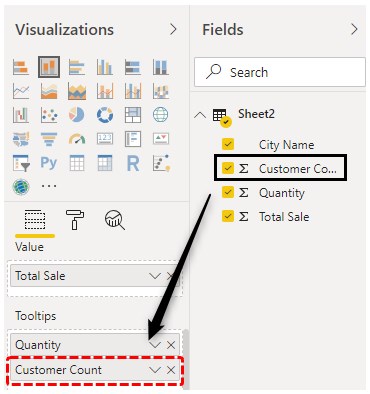
- Let’s drag a value from the Fields section say Quantity into tooltips.
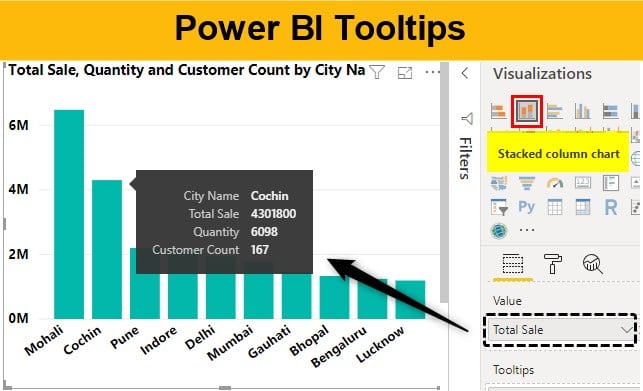
- Now if we, however, move the cursor on the same column with City name Cochin, we will now be able to see Quantity as well for which value is reflecting as 6098.
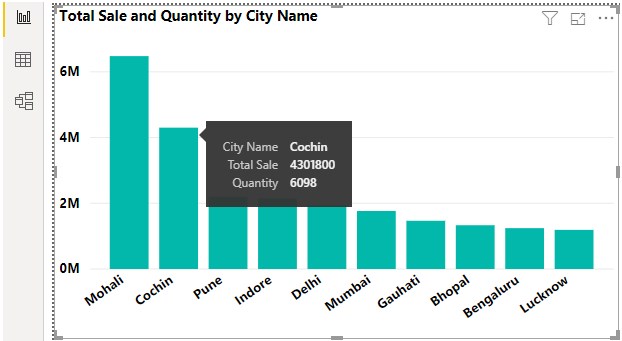
By this, we can summarize, for City Cochin total sale was Rs. 4301800/- from the quantities 6098.
- Let’s try to add another field into tooltips. Now we are adding Customer Count.
Now again, if we hover the cursor on Cochin, we will see Customer count is also reflecting there with the count of customer 167.
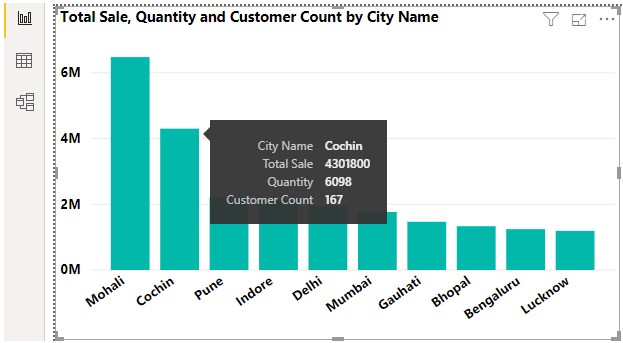
Again if we summarize this as for Cochin city, total sale was Rs. 4301800/- with quantities 6098 from 167 Customers. This is how tooltips in Power BI works.
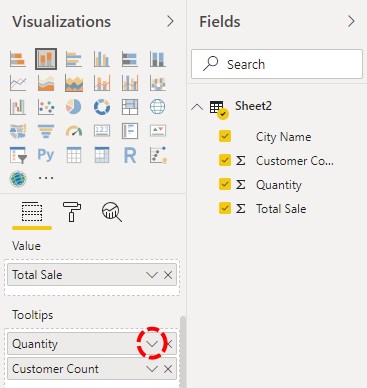
- We can even further customize the view of data reflecting on tooltips. For this, click on the down arrow which is on each of the fields under tooltips.
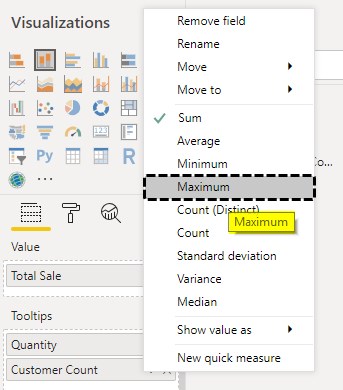
- Now select any of the mathematical functions from the list as shown below, to get further changes in the view.
Pros of Power BI Tooltips
The pros are:
- Without any further addition to the created charts, Tooltips gives us more details.
- There are no limits of adding fields in tooltips.
- Tooltips are used to show more informative charts and data.
Note: I have done so much of formatting to these charts, you can download the Power BI Tooltip file from below link and apply each formatting technique as applied.
Things to Remember
Things to remember when using Powerbi tools:
- We can customize the tooltips by choosing the type of mathematical operation such as Sum, Average, Percentage, Variance or Median to modify the views for tooltips without changing or modifying the data.
- Tooltips can only be accessed through a Report view in Power BI. This is the only place where can change anything in the chart without doing further changes to uploaded data.
- It is important to know what we want to see or show using tooltips customization. Although using the default properties of tooltips will also give the output but while selecting the custom operations, first determine the output we want to see.
- We do the changes in the uploaded data in the Data view tab or using the Query editor. But if the size of data is not big then if it is better to change the data in Excel instead of in the Power BI query.
Recommended Articles
This is a guide to Power BI Tooltips. Here we discuss how to use Power BI Tooltips to show additional data labels in the chart along with practical examples and downloadable power bi template. You may also look at the following articles to learn more –
