Revenue Per Employee Ratio Formula (Table of Contents)
- Revenue Per Employee Ratio Formula
- Revenue Per Employee Ratio Calculator
- Revenue Per Employee Ratio Formula in Excel (With Excel Template)
Revenue Per Employee Ratio
Analyst always looks to analyze the company financially as well as operationally. It must be remembered that the operational ratios also impact the financial ratio.
As legend investor warrant buffet says, operational efficiency leads to more profit. So, it becomes imperative to analyze the company operationally also.
As the employee is an integral part of every business, analyzing operational efficiency by analyzing the revenue-per-employee ratio makes more sense. It is the easiest ratio for operational analysis and is easy to interpret also.
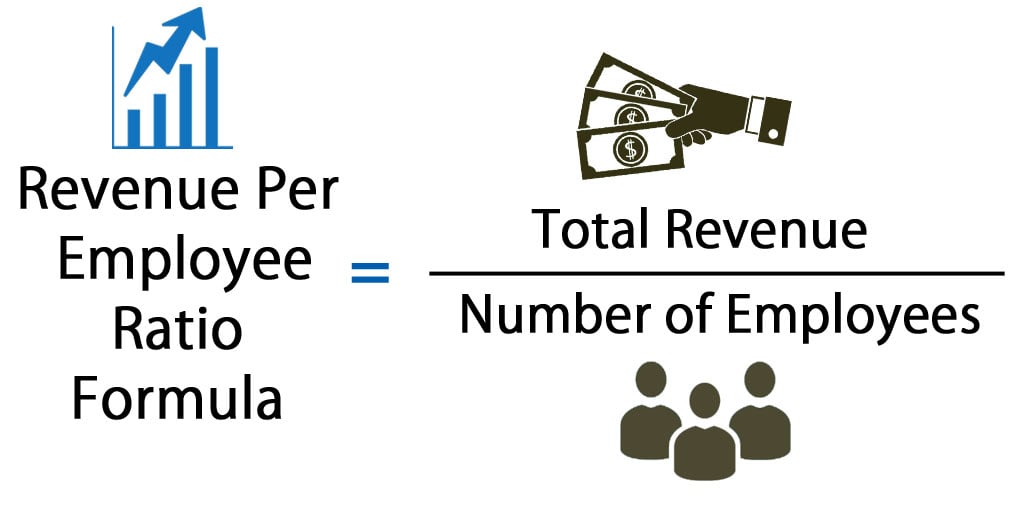
Revenue Per Employee Ratio Formula
Revenue per employee calculates the number of sales generated by one employee or sales done by each employee. This is one of the important measures of the company’s employees’ performance. It is an easy indicator of the productivity & efficiency of an organization’s personnel. It also indicates how effectively an organization is utilizing its human resources.
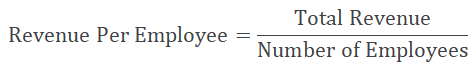
Revenue Per Employee Ratio Formula –
Generally, the number of employees keeps changing over period of time. Therefore, using an average number of employees during a particular period is good practice. Several employee figures can be found in the annual report of the company. The figure for sales revenue can be taken from the company’s income statement. From the above formula, it can be easily understood that revenue per employee is easy to calculate and interpret. By common sense, the higher the revenue per employee figure is, the better it is. Less revenue per employee shows less efficient operation.
But revenue per employee varies in different industries according to the need of labor requirements. Labor-intensive industries will be having less revenue per employee, whereas less labor-intensive industries will have high revenue per employee.
Examples & Explanation of Revenue Per Employee Ratio Formula
Below table shows the revenue per employee of a labor-intensive and less labor-intensive industry.
|
Labour Intensive Industry |
|||
|
Company Name |
Net Sales (million $) | Number of Employees |
Revenue Per Employee ($) |
|
Company ABC Ltd. |
25,000 |
80000 |
3,12,500 |
|
Company Aban Ltd. |
46,000 |
90000 |
5,11,111 |
|
Company KPIT Ltd. |
23,000 |
50000 |
4,60,000 |
|
Company PTC Ltd |
39,000 |
75000 |
5,20,000 |
|
Company XYZ Ltd |
90,000 |
180000 |
5,00,000 |
|
Less Labour-Intensive Industry |
|||
| Company Name | Net Sales (million $) | Number of Employees |
Revenue Per Employee ($) |
|
Company PQR Ltd |
20000 |
18000 |
11,11,111 |
|
Company MNO Ltd |
5000 |
1108 |
45,12,635 |
|
Company TPU Ltd |
6000 |
3000 |
20,00,000 |
|
Company KNO Ltd |
18000 |
15000 |
12,00,000 |
|
Company APP Ltd |
2000 |
1500 |
13,33,333 |
As discussed earlier, we can see a company’s classification as per the industry. The less labor-intensive company generates more revenue per employee. This is because of industry-specific advantages and variations in the operation.
Analysts generally compare revenue per employee with the median of companies in the same industry. Company MNO operates at the highest revenue per employee in a less labor-intensive industry because its operations are more efficient than its peers. It can be said that each employee in the MNO company is more efficient than the peer set. The same is true for labor-intensive industries.
Significance and Use of Revenue per Employee Ratio Formula
Revenue per employee is an absolute figure regarding a given currency; therefore, it may look less useful in an analytical sense. For interpretation purposes, revenue per employee should be compared with the company’s or industry’s historical data to see any deterioration or improvement. Compare it with the other peer companies operating in the same industry. This comparison across the industry and over time will give a useful understanding of personnel productivity.
Revenue per employee might be affected by the age of a company. New companies usually have small revenues, and these are usually in the process of hiring more employees to fill positions. Therefore, their revenue per employee is lower than that of well-established companies. Sometimes earnings per employee can be calculated using net profit, instead of sales revenue, in the above-stated formula. This also gives insights into the productivity of employees.
As the ratio is in the absolute figure by itself, it is of little use without any benchmark or frame of reference; hence it should be read against the historic ratios for the same industry or company over a number of past years to be able to see if the ratios are falling or rising. This would help to show declining or improving the level of employee productivity. Then again, compare the ratios with other industry peers and their performance over the past years.
Revenue Per Employee Ratio Calculator
You can use the following Revenue Per Employee Ratio Calculator
| Total Revenue | |
| Number of Employees | |
| Revenue Per Employee Ratio Formula= | |
| Revenue Per Employee Ratio Formula= | = |
|
|
Revenue Per Employee Ratio Formula in Excel (With Excel Template)
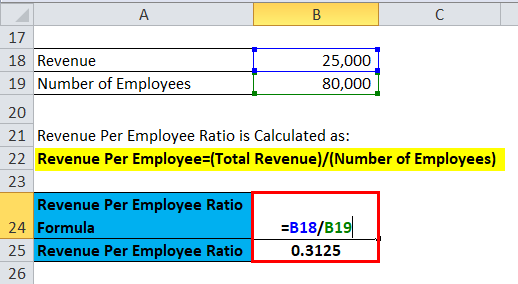
Here we will do the same example of the Revenue Per Employee Ratio formula in Excel. It is very easy and simple. You need to provide the two inputs i.e, Revenue and Number of Employees
You can easily calculate the Revenue Per Employee Ratio using the Formula in the template provided.
Recommended Articles
This has been a guide to a Revenue Per Employee Ratio formula. Here we discuss its uses along with practical examples. We also provide a revenue-per-employee ratio calculator with a downloadable Excel template. You may also look at the following articles to learn more –
