Updated July 24, 2023
Regression Line Formula (Table of Contents)
What is the Regression Line Formula?
The term “Regression Line” refers to the statistical technique which is used to model the relationship between two variables. In this technique, there is an explanatory variable and a dependent variable, and the former is used to draw insights about the latter and build its forecast.
In other words, it is used to make predictions about the dependent variable based on its relationship with the explanatory variable. The formula for the regression line (Y) can be derived by multiplying the slope of line (b) with the explanatory variable (X) and then adding the result to the intercept (a). Mathematically, the regression line equation is represented as,
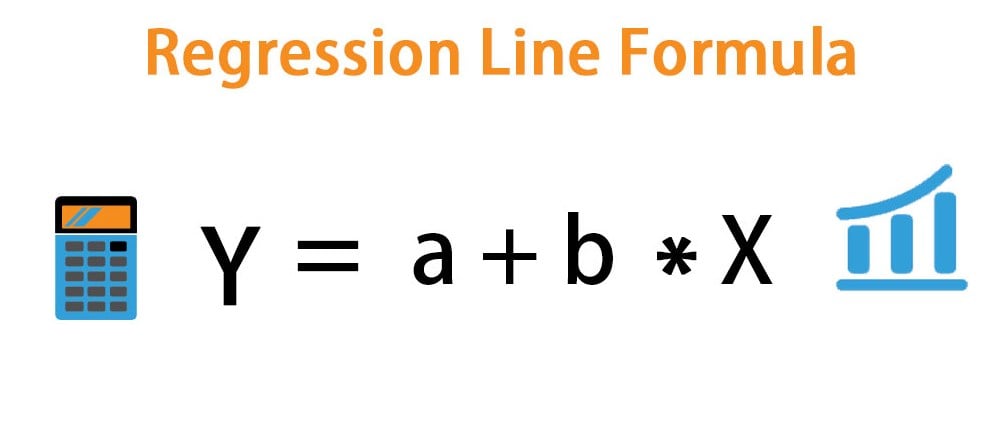
The formula for Regression Line –
Example of Regression Line Formula (With Excel Template)
Let’s take an example to understand the calculation of the Regression Line in a better manner:
Example #1
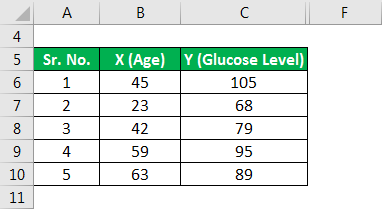
Let us take the example of a set of five patients whose glucose levels have been examined and presented along with their respective ages. Based on the given information, build the regression line equation and then calculate the glucose level for a person aged 77 by using the regression line equation.
Solution:
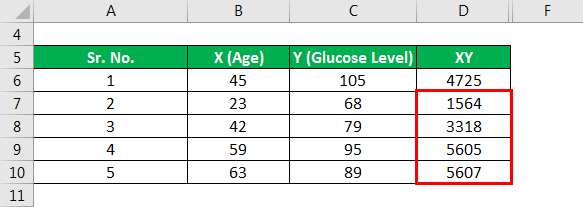
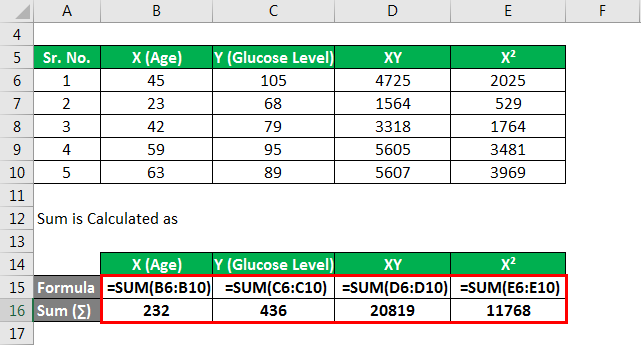
Now let’s calculate XY for ΣXY.
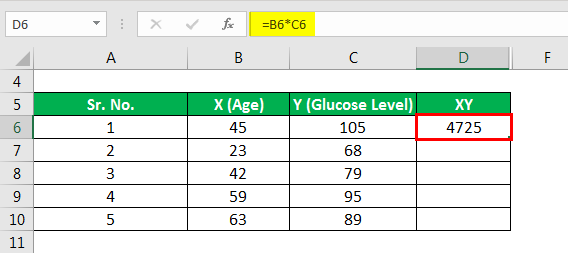
Similarly, calculated the below XY.
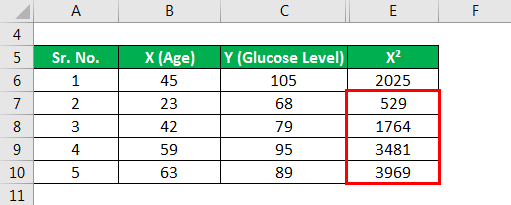
Now let’s calculate X² for ΣX².
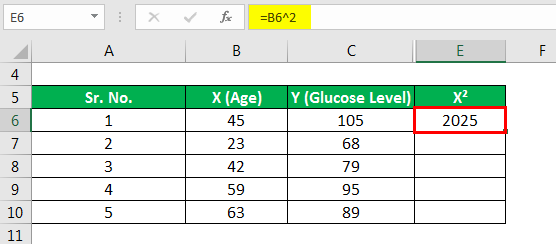
Similarly, calculated the below X².
Sum is Calculated as
b is calculated using the formula given below
b = [n * (∑XY) – (∑X) * (∑Y)] / [n * (∑X2) – (∑X)2]
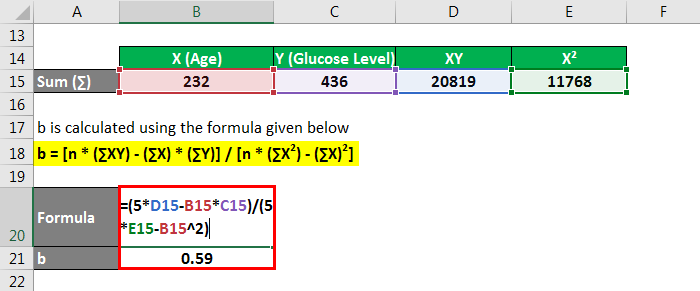
- b = [5 * 20819 – 232 * 436] / [5 * 11768 – (232)2]
- b = 0.59
a is calculated using the formula given below
a = [(∑Y) * (∑X2) – (∑X) * (∑XY)] / [n * (∑X2) – (∑X)2]
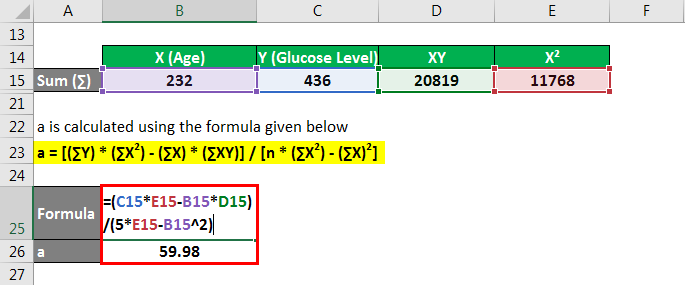
- a = [436 * 11768 – 232 * 20819] / [5 * 11768 – (232)2]
- a = 59.98
In the above equation, the glucose level of a person aged 77 years can be calculated as,
Regression Line is calculated using the formula given below
Regression Line Formula = Y = a + b * X
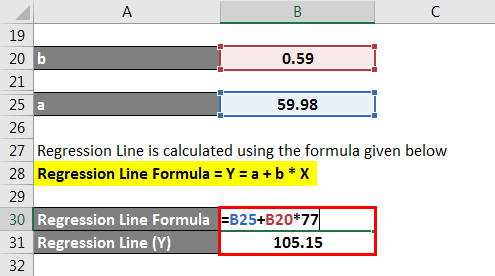
- Y = 59.98 + 0.59 * X
- Y = 105.15 ~ 105
Therefore, as per the regression level, the glucose level of a 77-year-old person is predicted to be 105mg/dL.
Example #2
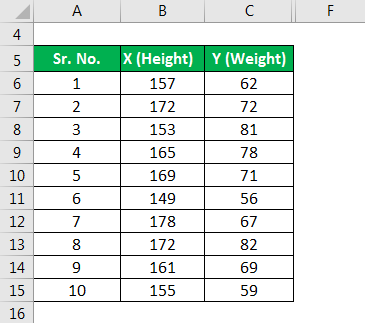
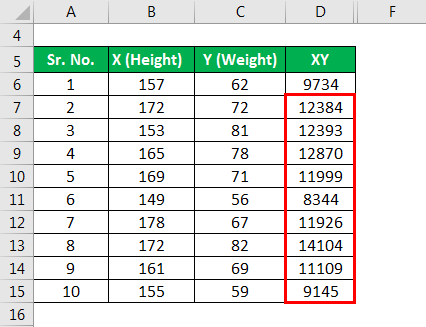
Let us take the example of a class with 10 students where their heights and weights were measured to check if their weight had any liner relationship with their height. The following information is available.
Solution:
Now let’s calculate XY for ΣXY.
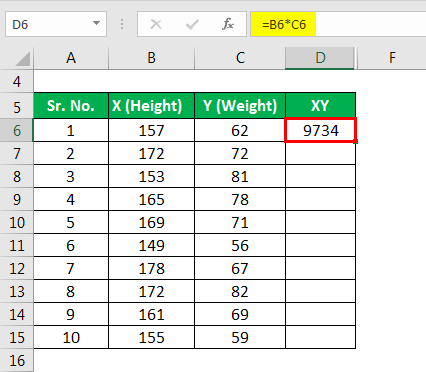
Similarly, calculated the below XY.
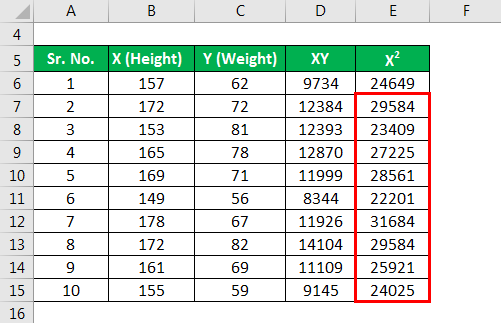
Now let’s calculate X² for ΣX².
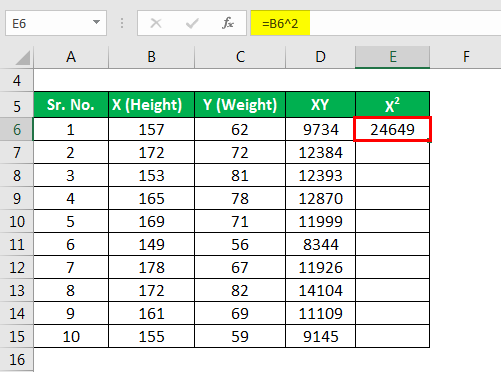
Similarly, calculated the below X².
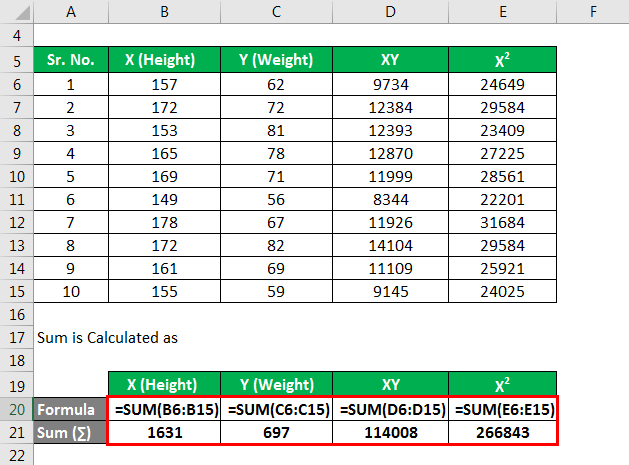
Sum is calculated as
b is calculated using the formula given below build the regression line equation based on the given information.
b = [n * (∑XY) – (∑X) * (∑Y)] / [n * (∑X2) – (∑X)2]
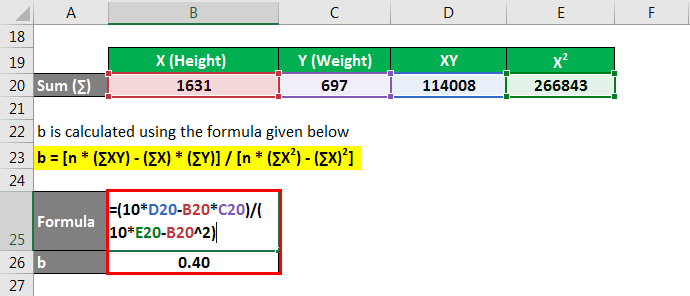
- b = [10 * 114008 – 1631 * 697] / [10 * 266843 – (1631)2]
- b = 0.40
a is calculated using the formula given below
a = [(∑Y) * (∑X2) – (∑X) * (∑XY)] / [n * (∑X2) – (∑X)2]
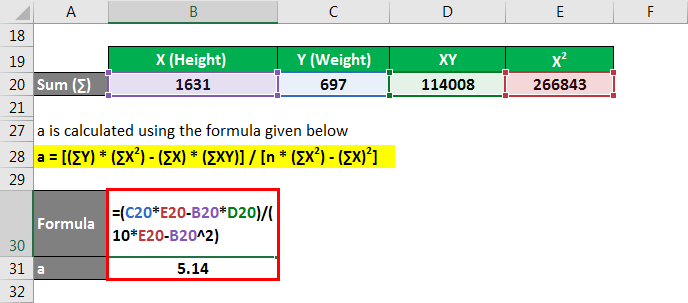
- a = [697 * 266843 – 1631 * 114008] / [10 * 266843 – (1631)2]
- a = 5.14
Regression Line Equation is calculated using the formula given below
Regression Line Formula = Y = a + b * X
Y = a + b * X
Or Y = 5.14 + 0.40 * X
Explanation
The Regression Line Formula can be calculated by using the following steps:
Step 1: Firstly, determine the dependent variable or the variable that is the subject of prediction. It is denoted by Yi.
Step 2: Next, determine the explanatory or independent variable for the regression line that Xi denotes. It should be selected such that it can adequately explain the variation in the dependent variable.
Step 3: Next, determine the slope of the line that describes the relationship between the independent and the dependent variable. It is denoted by “b” and is calculated based on the number of data points (n), explanatory and dependent variable by using the following formula
b = [n * (∑XY) – (∑X) * (∑Y)] / [n * (∑X2) – (∑X)2]
Step 4: Next, determine the intercept of the regression line that remains constant irrespective of the explanatory variable’s value. It is denoted by “a” and is calculated based on the number of data points (n), explanatory and dependent variable by using the following formula
a = [(∑Y) * (∑X2) – (∑X) * (∑XY)] / [n * (∑X2) – (∑X)2]
Step 5: Finally, the formula for the regression line can be derived by multiplying the explanatory variable (step 2) and the slope of the line (step 3) and then adding the result to the intercept (step 4) as shown below.
Y = a + b * X
Relevance and Use of Regression Line Formula
It is one of the few important concepts for model building, and it is predominantly used to build the predictive model by applying the technique of best fit to the relationship between explanatory and dependent variables. It finds applications in various finance models that include the CAPM method, revenue forecasting, etc.
Recommended Articles
This is a guide to the Regression Line Formula. Here we discuss how to calculate the Regression Line along with practical examples. We also provide a Regression Line calculator with a downloadable excel template. You may also look at the following articles to learn more –
