Updated June 14, 2023
Introduction to R Tools Technology
R tool for analytics is the most powerful and widely-used programming language for computational statistics, visualization, and data science. Many data scientists and statisticians use R to solve their problems in the data analysis field in all the sections, from computational biology to quantitative marketing. R is a GNU project which is more like the S language. It is considered as a dialect of the S language.
R tool for data Analysis provides various statistical and graphical techniques. R is highly extensible and offers a lot of choices for research people. R is free software that runs on various platforms like MacOS, Windows, UNIX, and Linux. It is also the most popular and successful language with some powerful features. It is used by top-rated companies like Google, Facebook, Shell, Merck, Bank of America, Pfizer, and LinkedIn.
Installation of R Tools Technology
Here is a detailed tutorial with screenshots to install R tools technology
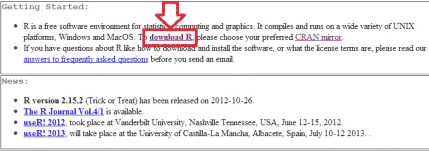
1. Go to the R website and click Download R under the heading “Getting started”
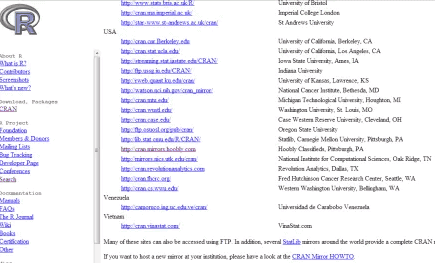
2. Select a destination to download R.
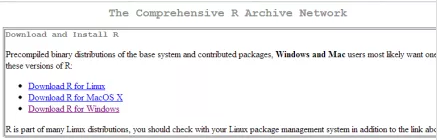
3. Choose which R package to download based on your OS.
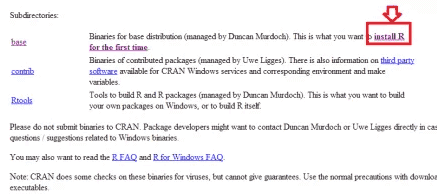
4. Select “Install R for the first time” and download the file with the biggest font on the top.
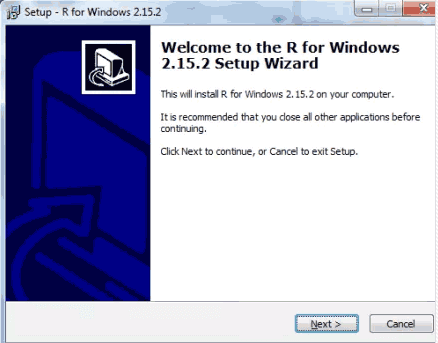
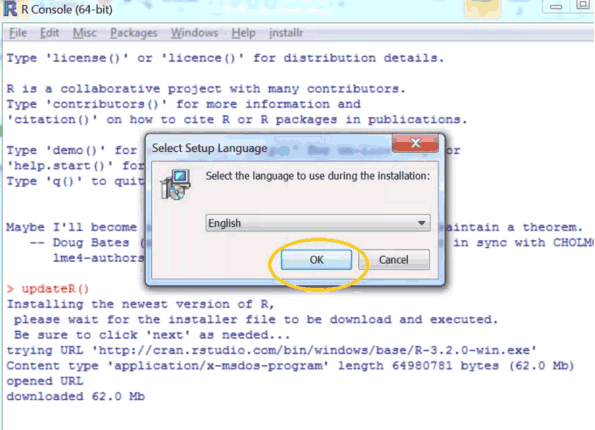
5. Click “Run” and then choose your language.
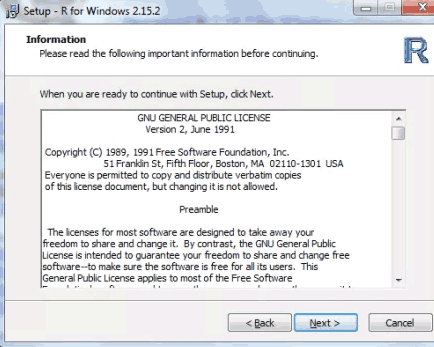
6. Click “Next” to start the installation and agree to all their terms and conditions.
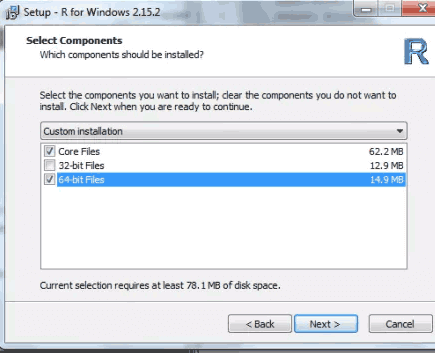
7. Select Core files and select either 32-bit or64 bit files based on your computer system.
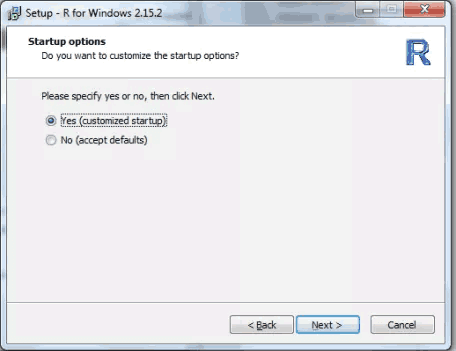
8. You have a choice for Startup options. You can view the program in multiple windows so that you can also have an internet browser or notepad program open as well. The screen appears as below.
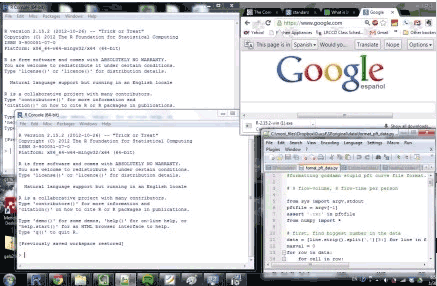
9. If you want to get this view, then you should click Yes for the customized startup option in the Startup option.
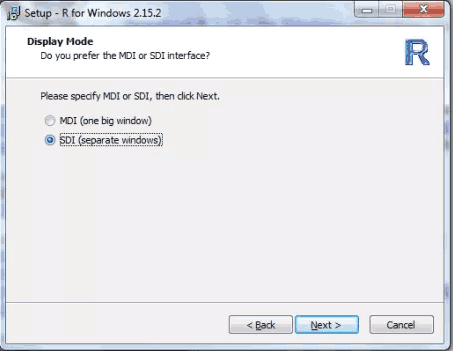
10. If you have clicked. Yes, then you will be directed to the below dialog box and select the “SDI” (separate window) option.
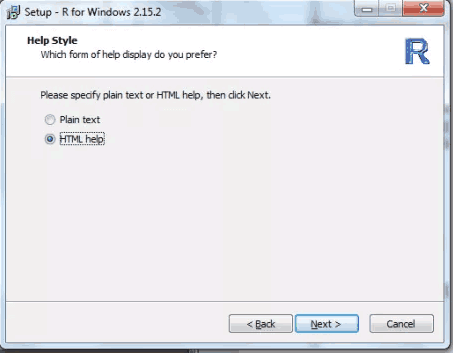
11. In this step, you choose between plain text or HTML.
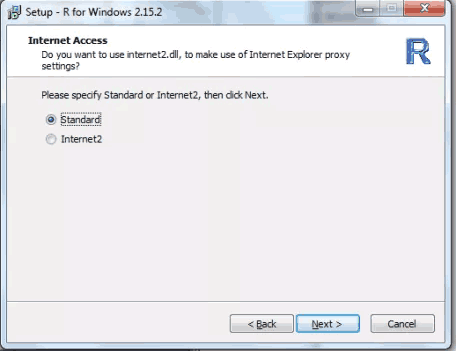
12. The next step is to select between standard or Internet2 for Internet access.
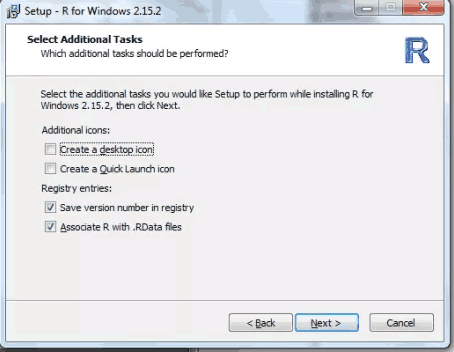
13. Create a program shortcut and desktop icon by clicking Next.
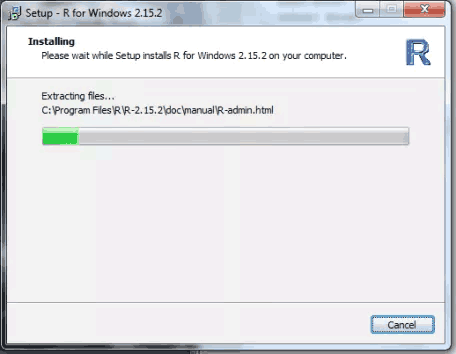
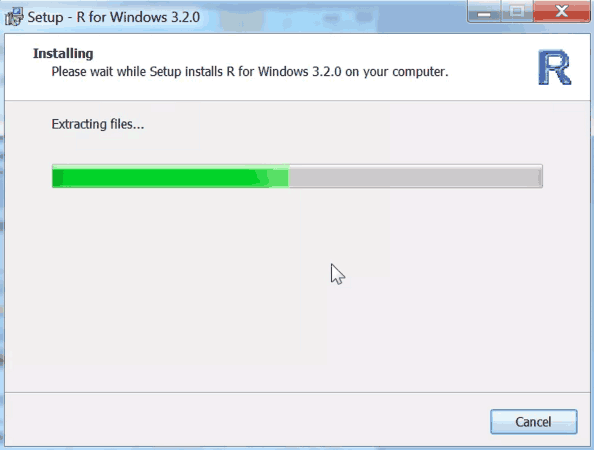
14. The installation will start running, as shown in the figure below.
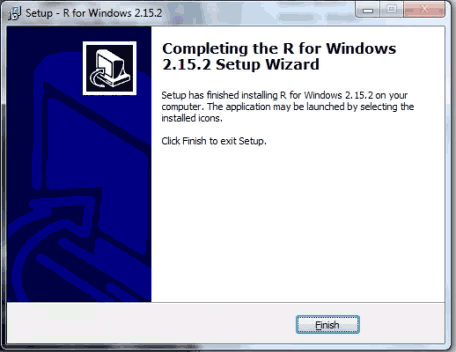
15. Once the installation is complete, you will get the following window. Click “Finish”
Environment
R tool is an integrated suite of software facilities developed for data analysis, statistical modeling, simulation, and graphics. R is a simple and effective language that includes conditionals, loops, user-defined recursive functions, and input and output facilities. R includes the following.
- Effective data handling and storage facility
- Set of operators for the calculation of arrays
- A huge integrated collection of intermediate R tools for data analysis
- Graphical facilities to be displayed either on screen or on hard copy
- Allows users to add additional functionality
- C, C++, and Fortran code can be linked to R tools technology and called at run time.
- R can be extended through packages easily.
- R has its own Latex-like documentation format, which supplies comprehensive documentation.
Updating
Follow these simple steps to Update R.
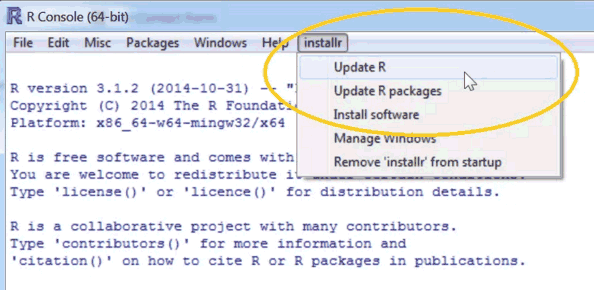
1. Load the Installr

2. Select “Update R” from the new ” Installr” menu
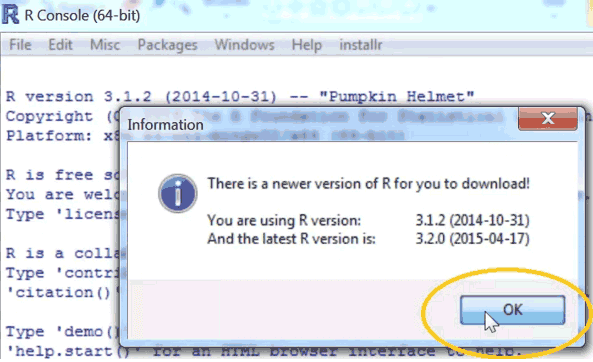
3. Installr will check whether there is a new version to update and click Ok.
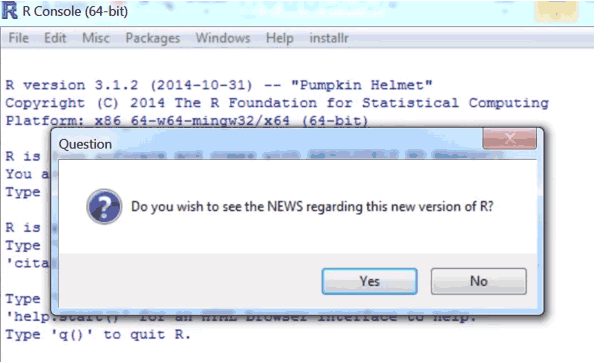
4. If you wish to check the News of the new version, click Yes.
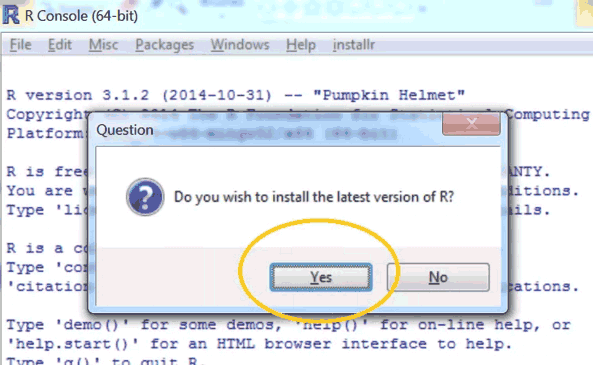
5. Click Yes if you want to download and install the latest R version.
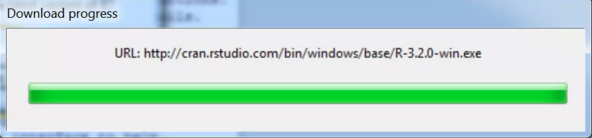
6. The download will start.
7. Press ‘Next’ in the R’s installation wizard.
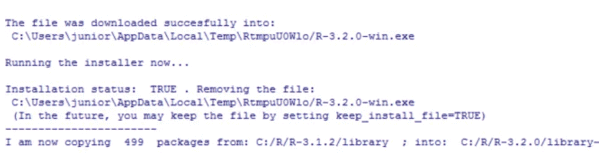
8. Wait till the R finishes its installation.
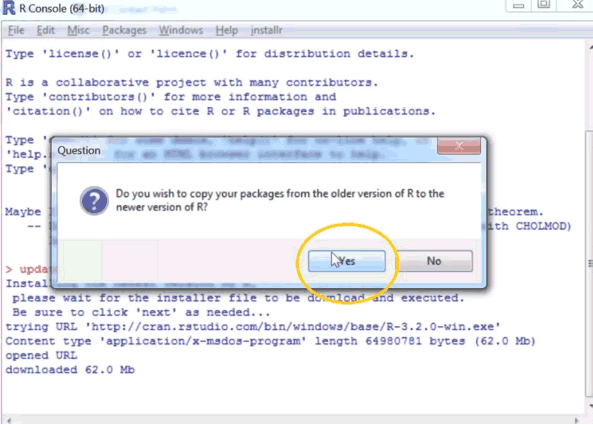
9. Press Yes to copy your packages to the new R installation.
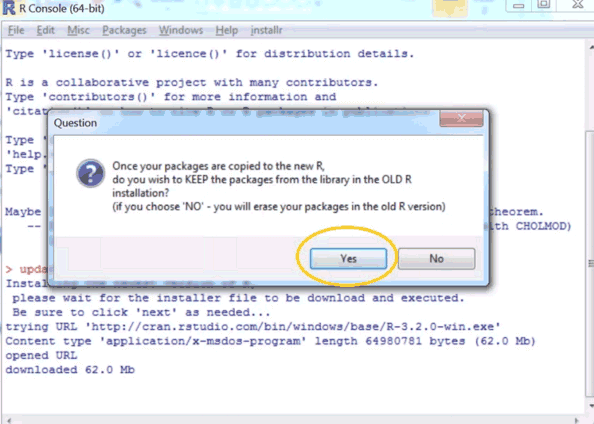
10. Click Yes to keep your package in your Old R folder.
11. Wait till the packages get copied.
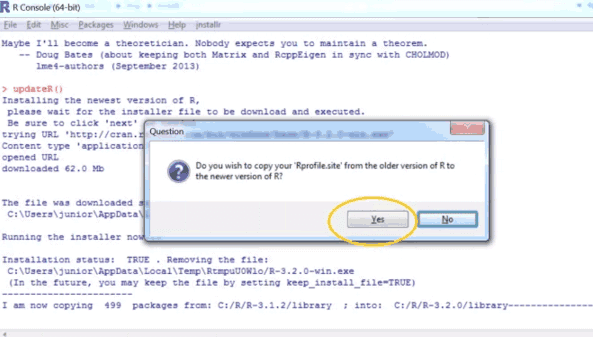
12. You can also get Rprofile .site to be copied automatically to the new location.
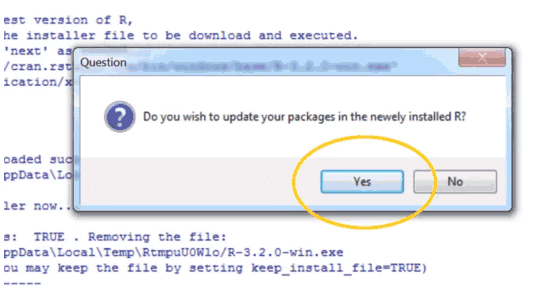
13. Click Yes to get updated packages in the new R installation.
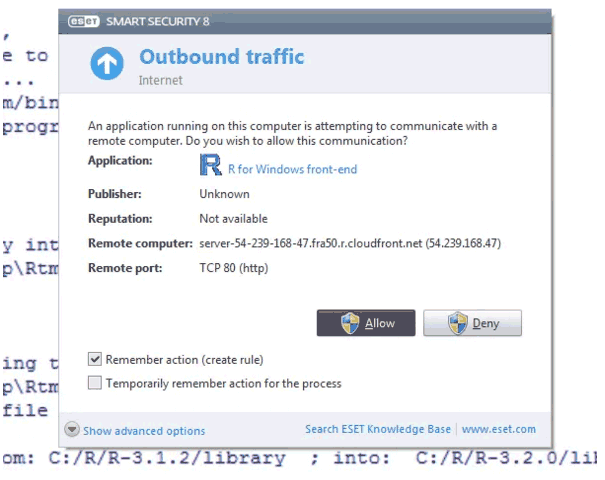
14. R needs your permission to access the internet.
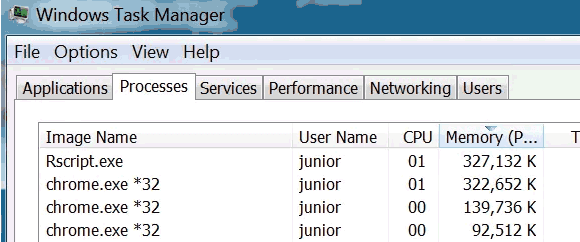
15. Wait till the packages are updated and the process is run in the background.
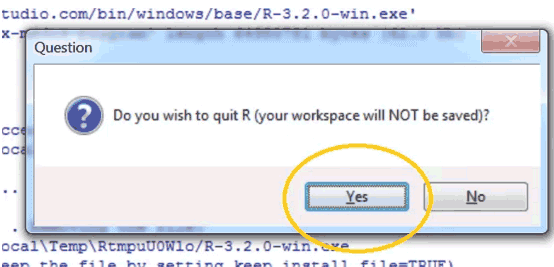
16. The final step is to Quit R.
Why Use R Tools Technology?
There is a lot of software available for data analysis today, but still, the R tool stands ahead of all the other tools. There are a lot of reasons why data scientists choose R. Few reasons are listed below.
1. R tools technology is free
R is an open-source project which you can download and use for free. You don’t have to worry about subscription fees, license fees, license renewals, or user limits. As R is open-source software, you can inspect and make changes to the code as you like. A lot of experts have contributed to R in such a way, and now it benefits millions of people who use R today.
2. R is not just a statistical package; it is a language
R is an easy language to learn. In R, data analysis is done by writing functions and scripts, not just in simple clicks. It offers a natural and expressive way for data analysis. There are many advantages to learning this language. It is the most interactive language when compared with other programming languages. R provides an innovative way of data analysis and leads to better results which otherwise would not have been done. A script records all your work which can be re-run at any time. These scripts also make it easy for you to automate a sequence of tasks that can be integrated into other processes.
3. R tool for analytics techniques at your fingertips
R contains all the traditional and recently developed data manipulation techniques. It also offers you different statistical models and charts that all the data scientists feel are essential to them. You can easily download any method free of cost.
4. Powerful graphics and Data Visualization
One of the main features of R tools technology is the visualization of data through charts and graphs. R tools technology offers special tools for producing graphics from information provided in the form of bar charts and scatter plots to multi-panel Lattice charts. Experts in data visualization, like Bill Cleveland and Edward Tufte, also believe in R’s graphical system. Because of its excellent graphical properties, R tools technology is used in reputed places like the New York Times, the Economist, and the FlowingData Blog.
5. Faster and better results
R stands ahead of the usual black-box procedures of other data analytics tools. R is designed especially for data analysis to create faster results than other statistical software programs. It also offers you mix-and-match models for better results. The scripts of R are automated, which helps you to deliver reproducible research.
6. Cutting-edge statistics with R tools technology
Leading data scientists and researchers around the world use R for statistics, machine learning, and predictive modeling. R has a lot of packages that are not available in any other statistical tool in the data analysis market. There are more than 2000 packages available in the R language in every domain for free download. And more packages are added frequently. Because of such packages, R tools technology is widely used in fields like finance, genomics, and a lot of others fields. One example of such a package is “glmnet”. This is an exclusive modeling package that handles the prediction of interval and categorical dependent variables efficiently.
7. Flexible R tool for data analysis
R tools technology has an inbuilt standard data analysis tool that includes accessing data in various formats, data manipulation, and traditional and modern statistical models. The statistical models include regression, ANOVA, GLM, tree models, and others. All the statistical tools are available in an object-oriented framework that will help you to extract only the information you need from the results. It will thus reduce unwanted statistics, and you don’t have to produce a cut-and-paste static report.
8. Robust community
If you have any questions related to R, then there is definitely an answer for you on the web. There are a lot of community resources available on the internet for R. R has thousands of contributors and more than two million users from around the world. This is one of the main reasons you can find answers to all your questions related to R on the web.
9. Unlimited possibilities
R is an open-source community, and a lot of people contribute directly to the R language. It does not have a predefined set of codes. You can use codes that are contributed by others to the R community. You can also extend the R functions. R gets mingled up easily with other applications like MySQL database, Apache web server, Google Maps, and others.
10. Wide acceptance of R
R is used widely by most industries in India and abroad. R is becoming a leader in the business analytics field. Recently SAS is also being integrated with R and is included in SAS/ML Studio 3.2 version. It is also mostly used in clinical research by the government.
Special Features
Following are some of the special features of R Tools.
- R is available for Windows, Linux, and MacOS platforms
- R lets you input data from SAS, Excel, SPSS, STATA, and others
- R is an excellent tool for creating complicated plots and charts which will be of great quality
- R lets you display statistical concepts by means of animations
- R can be embedded in Excel. This will provide you with a whole new range of statistics and graphical properties
- R has very good community support, which gives answers to all your queries. Most of the responses come from experts in the data analysis field. The community gives you a detailed insight into the R language for newbies
- R provides data analytics solutions on the web by embedding R on a server through the Apache server
- R has a lot of packages that are written for a specific purpose. All the packages are contained in CRAN, and the packages are divided based on their target domain
- R contains codes to perform all the basic and advanced statistics
- R has Revolution Computing which is an enterprise R provider
- R has a blog for them that discusses the latest developments, usages of R in various fields, and various other matters which are related to R
Why R Tools Technology gets so much Attention?
There are many languages used for data analysis, but most people prefer using R for their business. The reasons why R is preferred more than other languages are listed below.
- More interactive language – For data analysis, two things are more important – Interactivity and Language. R, in other terms, is an interactive language which makes it more special than other languages.
- Data structures – It also offers you an excellent way to create data structures. You don’t need to put all your data in a set of predefined structures. You can create your own structure and put your data in a natural form.
- Excellent graphical properties – Human brains are more attracted to pictures than numbers or text. R gives you a high-quality graphical representation of data.
- Missing values – Real data always have missing values. R has several functions that will help you deal with missing values. Missing values are an integral part of R.
- A lot of packages – R has a lot of packages that allow you to add your own functionality to make it unique. These packages help you do extraordinary things with R.
- Support and Community – R has a very supportive community which helps to improve data analysis done through R language.
- First-class objects – Objects here mean functions like mean and median. You can shift between the functions more easily in the R language.
- Vector-oriented – Objects in R are considered as a whole rather than treating them as a collection of individual numbers. For example, if you want to change the volume from liters to milliliters, then a simple code change has to be done.
- Flexibility – R does not compel you to work only within its language. You can mix different tools and select the best tool for each task. You can also call C and C++ functionality.
- Changes made easy – The codes that are written in R language are accessible to the users. If any minor change has to be made to the task, then you can make a change to the code in a shorter period of time.
Connecting MySQL from R Tools Technology
There are two ways through which you can connect to MySQL from R
- Using RODBC library
- Using MySQL library
Here are a few steps to explain to you how MySQL is connected to R through the ODBC library.
- Download the ODBC driver from the site.
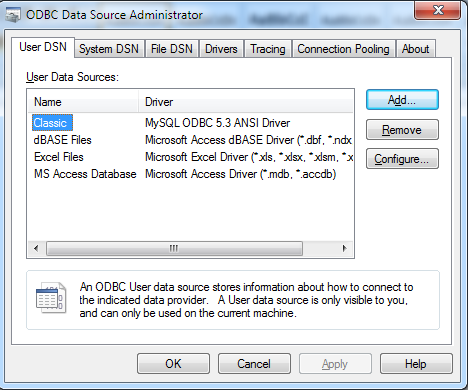
- To ODBC setup, Go to Control Panel à Administrative tools à ODBC.
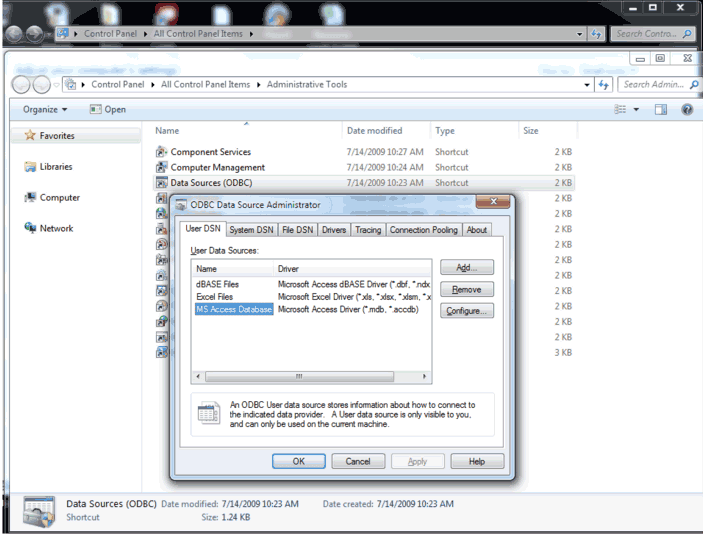
- Click Add to add a new ODBC Setup for MySQL.
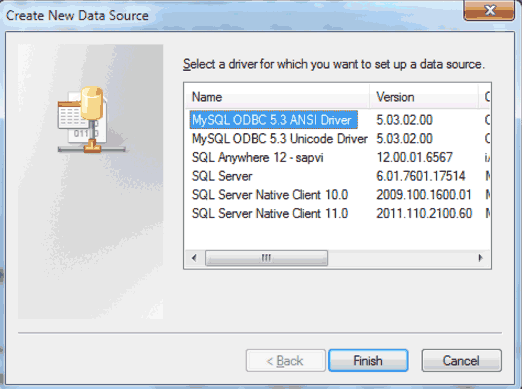
- Click Finish. Now you will get a screen where you need to enter the IP address of the MySQL server.
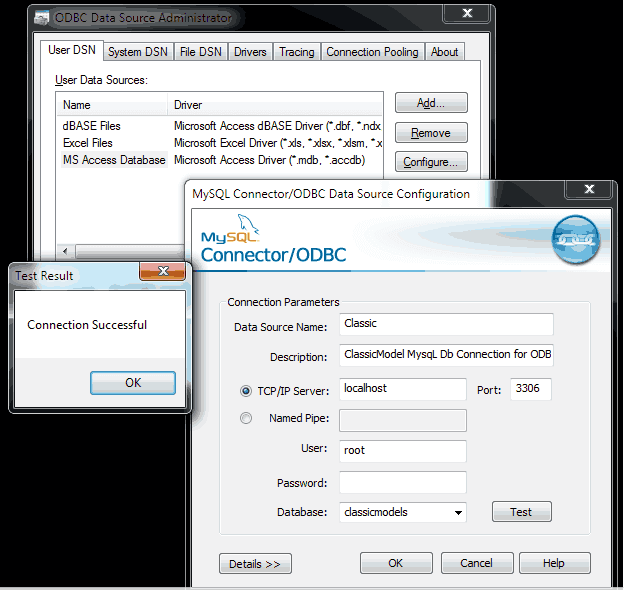
- After the MySQL ODBS connection is made, move to R to invoke this data source and access any one of the tables in R.
- Now load the library RODBC using the following command.
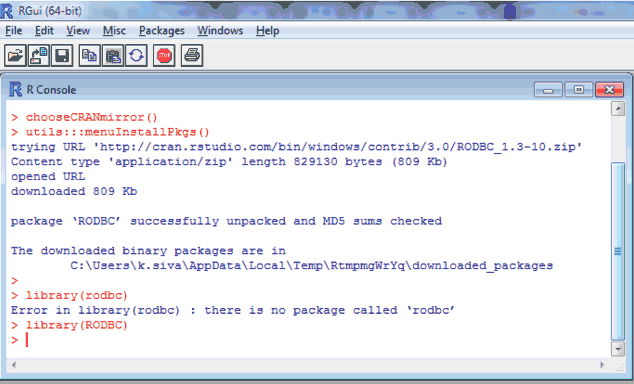
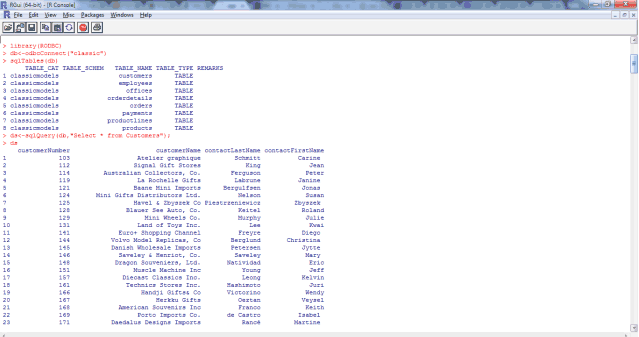
- Once RODBC is installed, connect to the classic model’s database in MySQL and test the RODBC library.
Scatter Plot with R Tools Technology
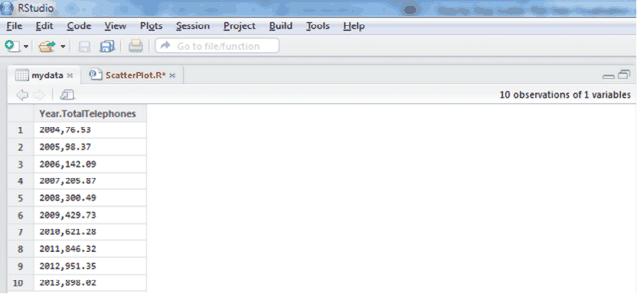
The following table provides you with the data. One column has Years, and the other one is the Total Telephones sold, which is in millions.
| Year | Total Telephones Sold |
| 2004 | 76.53 |
| 2005 | 98.37 |
| 2006 | 142.09 |
| 2007 | 205.87 |
| 2008 | 300.49 |
| 2009 | 429.73 |
| 2010 | 621.28 |
| 2011 | 846.32 |
| 2012 | 951.35 |
| 2013 | 898.02 |
Step 1: Load this data into R using the load.csv method.
Step 2: Now you have the data in my data section, as shown below.
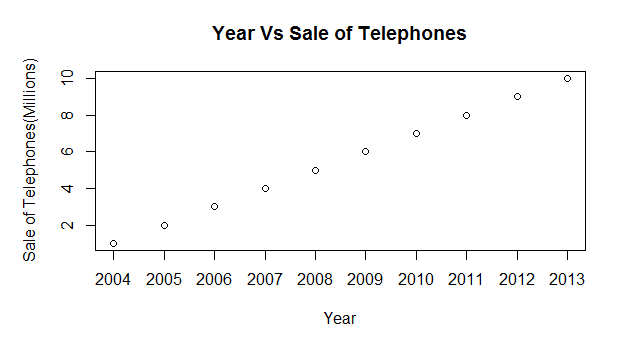
Step 3: Now plot the graph using the command.
Step 4: Your result will be shown as follows.
Applications
R tools technology applications are used in a wide range of fields, from astronomy, finance, and chemistry to medicine and much more. R’s packages are dedicated to specific applications. You can also create your own R application, and you don’t need to be a genius to do that. Some of the R packages for applications are listed below.
- Clinical Trials
- Cluster analysis
- Computational Physics
- Differential Equations
- Environmental Studies
- Finance
- Genetics
- Graphical Models
- Graphics and Visualization
- Machine learning
- Medical Imaging
- Natural Language Processing
- Official Statistics
R Community
R is a global community where a lot of people spend their time and effort to maintain and develop the R language and its environment. This community plays an important role in making R a high-quality and transparent software. R community does the following activities.
- Supports and enhances the R language
- Enlarge the scope and power of the R language
- Create new applications in different fields using R
- Talk about the benefits and advantages of R
- Provide help for beginners to start with R
Contributors
R has thousands of contributors from different parts of the world. The heavy lifters of R are the members of the R group. They make changes, fix bugs, test the code, maintain the CRAN, and keep it going on all the supported platforms.
Conclusion
From this article, you can have a clear idea about R tools technology. It is also proven that it is the most important platform for the development of new statistical methods. It stands ahead of other data analysis tools. If you are a data scientist, then you should definitely learn R, like any other language. If you love programming, then you will definitely love working with R tools technology. If you want to become a master of R language, then you need to practice the language often and use it for performing important tasks.
Recommended Articles
We hope that this EDUCBA information on “R Tools Technology” was beneficial to you. You can view EDUCBA’s recommended articles for more information.
