Updated November 18, 2023
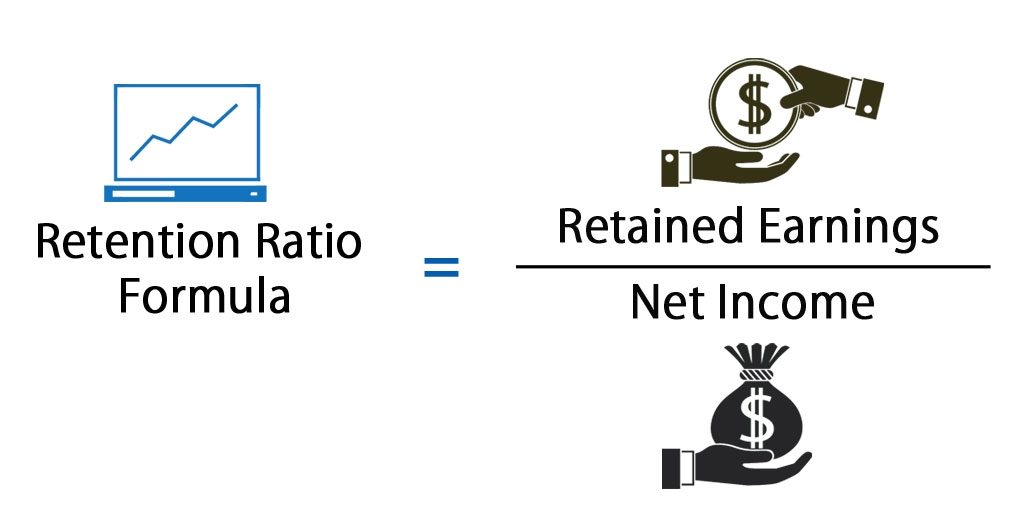
Retention Ratio Formula
Equity shareholders invest in the company, which can pay back through dividends and capital gains. While analyzing a company, it is always good to look into how much it is paying a dividend to its investors and how much it is keeping for its usage.
A dividend gives investors immediate cash, whereas money that the company kept will be reinvested into the business, giving greater returns in the long run. Understanding this retention ratio helps a lot.
Retention Ratio Definition & Formula
The retention ratio also called the blowback ratio, is an important financial parameter that measures the number of profits or earnings added to retained earnings (reserves) at the end of the financial year. Simply put, the retention rate is the percentage of net profits retained by the company and not distributed as dividends to investors at the end of the financial year.
The retention rate is calculated by subtracting the dividends distributed (including dividend distribution tax) by a company during the period from the net profit and dividing the difference by the net profit for the period.
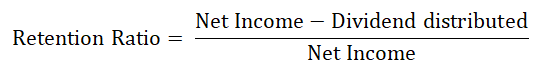
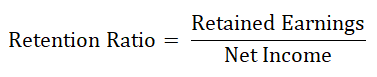
The numerator of the above equation calculates the earnings that were kept during the year since all the profits generated by the company that are not distributed as dividends to the investors during the period are kept by the company. One could simplify the above formula by rewriting the numerator as earnings retained during the year divided by net income.

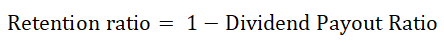
The retention ratio can also be calculated if we know the dividend Pay-out ratio.
Examples of Retention Ratio Formula
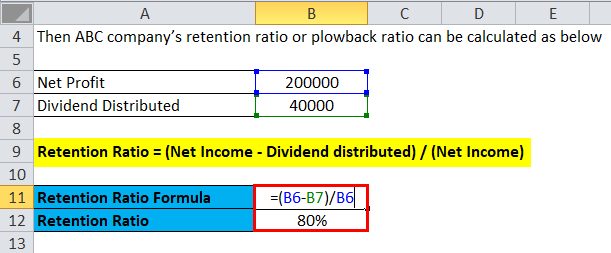
ABC Company earned $200,000 in net profit during the financial year and decided to give dividends of $40,000 to its shareholders.
The following calculations show how to calculate the retention or plowback ratios.
- Retention Ratio = (Net Income – Dividend distributed) / (Net Income)
- Retention Ratio = ($200,000 – $40,000) / $200,000
- Retention Ratio = 80 %
Or,
- Dividend Pay-out Ratio = 40,000 / 200,000
- Dividend Pay-out Ratio = 20 %
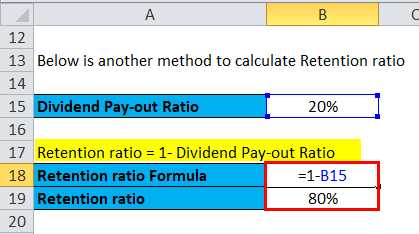
- Retention Ratio = 1 – Dividend Payout Ratio
- Retention Ratio = 1 – 20 %
- Retention Ratio = 80 %
As you can see, ABC company’s retention rate is 80 percent. In other words, ABC keeps 80 percent of its profits in the company, and only 20 % of its net profit profits are distributed to shareholders as dividends. 80 % of the net profit is retained in the business shows the business is in a growth phase and more capital is required for future growth. Though one ratio is insufficient to jump to a conclusion, analysts or investors need to look into other parameters to assess the growth.
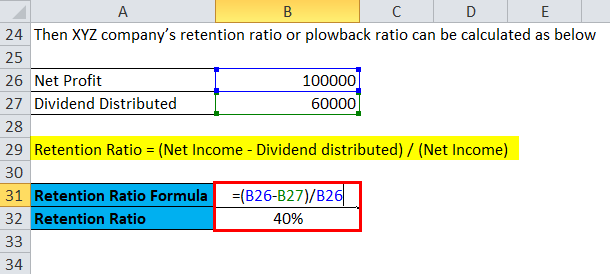
Company XYZ had a net profit of 100,000 during the financial year FY 2019, and management decided to distribute a dividend of 60,000 (including dividend distribution tax) to its shareholders.
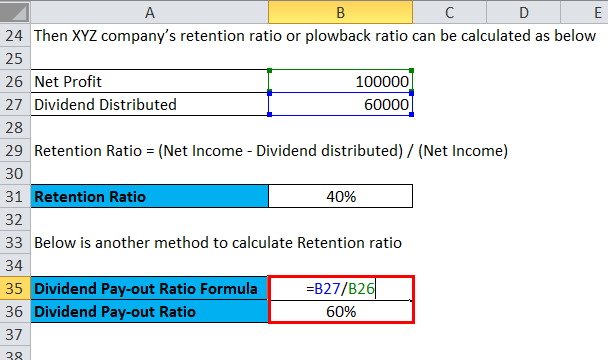
Then XYZ company’s retention ratio or plow back ratio can be calculated using the formula below –
| Net Profit | 100000 |
| Dividend Distributed | 60000 |
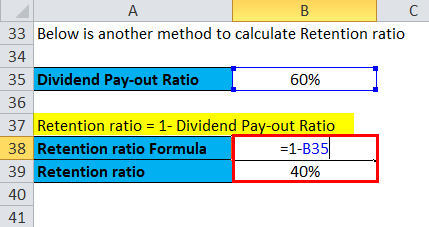
- Dividend Pay-out Ratio = 60,000 / 100,000
- Dividend Pay-out Ratio = 60 %
- Retention ratio = 1 – 60 %
- Retention ratio = 40 %
The same can be calculated by putting direct values into the formula
- Retention Ratio = (Net Income – Dividend distributed) / (Net Income)
- Retention ratio = ($100,000 – $60,000) /$100,000
- Retention ratio = 40 %
Company XYZ retains 40 % of the total profit and distributes 60 %; it can be seen as a signal of slow growth in the company’s business or the company doesn’t need more cash for its future growth.
Explanation of Retention Ratio Formula
As companies need to keep part or a full portion of their net profits to continue their operation and grow, investors take this ratio to help forecast where companies will be soon. Mature companies will start giving a dividend; growing companies will try to keep as much profit as possible to fuel the company’s future growth. Most of the tech companies rarely gave dividends because these companies wanted to reinvest in their business and continue to grow at a good rate. The exact opposite is true for established companies like General Electric. General Electric gives dividends every year to its shareholders.
Higher retention ratios are not always considered good from an investor’s point of view because this means the company doesn’t give many dividends. It might also mean that the stock price is continually appreciating because of company growth prospects. This ratio helps to understand the difference between earnings and growth stocks.
Interpretation
This is one of the important financial metrics because it shows how much a company is re-investing into its operations. Without a consistent reinvestment rate, the company’s growth would be completely dependent on financing from creditors and investors. The company’s on-growing track keeps maximum retained earnings to fuel future growth. So, such companies’ retention rate is higher sometimes; it may touch as high as 100%. On the other hand, companies in the mature phase don’t need much cash for growth, so these company distributes cash to investors as dividends and retains less from the profit. This can be touched as 100% of the profit distributed as dividends. The retention ratio also shows management’s attitude toward giving investors back. A lower retention ratio is also an indication of fewer re-investment opportunities in the same business.
In simple words, the retention ratio is the opposite of the dividend payout ratio because it shows how much money from the profit the company decides to keep in its bank account. In contrast, the dividend payout ratio shows the percentage of profits a company distributes to its shareholders. The dividend payout ratio decreases retained earnings, whereas the plowback or retention ratio increases retained earnings. Future growth potential and retention ratio are so directly linked that future growth rate can be calculated as a product of the company’s return on equity and retention ratio.
Retention Ratio Formula Calculator
You can use the following Retention Ratio Calculator
| Retained Earnings | |
| Net Income | |
| Retention Ratio Formula | |
| Retention Ratio Formula | = |
|
|
Retention Ratio Formula in Excel (With Excel Template)
Here, we will do the same example of the Retention Ratio formula in Excel. It is very easy and simple. You need to provide the two inputs, i.e, net income and dividend distributed
You can easily calculate the Retention Ratio using the Formula in the template provided.
We can calculate the Retention Ratio using the Formula
The retention ratio can also be calculated if we know the dividend Pay-out ratio. We can get the dividend Pay-out ratio by subtracting dividends from Net Income.
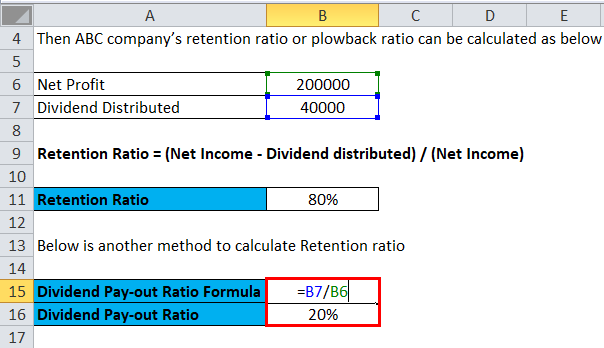
Then, we can calculate the Retention ratio from the dividend Pay-out ratio value.
Below is another example. We can calculate the Retention Ratio using the Formula.
The retention ratio can also be calculated if we know the dividend Pay-out ratio. We can get the dividend Pay-out ratio by subtracting the Dividend distributed from Net Income.
Then, we can calculate the Retention ratio from the dividend Pay-out ratio value.
Recommended Articles
This has been a guide to a Retention Ratio formula. Here, we discuss its uses along with practical examples. We also provide a retention ratio calculator with a downloadable Excel template. You may also look at the following articles to learn more –
