EDUCBA

EDUCBA

MENUMENU
  • Free Tutorials
  • Free Courses
  • Certification Courses
  • 360+ Courses All in One Bundle
  • Login
Home Data Science Data Science Tutorials Matlab Tutorial Polar Plot in Matlab
Secondary Sidebar
Matlab Tutorial
  • Advanced
    • MATLAB Class
    • Arrays in MATLAB
    • Matlab find value in array
    • MATLAB Grader
    • Power Spectral Density MATLAB
    • Matlab Textscan
    • String Array in MATLAB
    • MATLAB Random Numbers
    • Matlab Dot
    • MATLAB 2D Array
    • MATLAB? zero padding
    • MATLAB sort matrix
    • MATLAB Plot Function
    • 2D Plots in MATLAB
    • 3D Plots in MATLAB
    • MATLAB Fread
    • Spectrogram MATLAB
    • MATLAB Average
    • MATLAB exponent
    • MATLAB not enough input arguments
    • MATLAB comment
    • MATLAB zpk
    • Scatter Plots in MATLAB
    • MATLAB 3d scatter plot
    • Bar Graph in MATLAB
    • Bar Plot MATLAB
    • Log Plot MATLAB
    • Polar Plot in MATLAB
    • Surface Plot in MATLAB
    • MATLAB Plot Circle
    • Boxplot in MATLAB
    • MATLAB Plot Multiple Lines
    • Linspace MATLAB
    • Histogram in MATLAB
    • Plot Vector MATLAB
    • MATLAB Legend
    • MATLAB Plot Legend
    • MATLAB ezplots
    • Column Vector MATLAB
    • MATLAB Plot Marker
    • MATLAB LineWidth
    • MATLAB Line Style
    • Contour plot in MATLAB
    • MATLAB Sine Wave
    • Reshape in MATLAB
    • Natural Log in MATLAB
    • Random Number Generator in MATLAB
    • Complex Numbers in MATLAB
    • MATLAB Figure
    • Heatmap in MATLAB
    • MATLAB Technical Computing
    • Colors in MATLAB
    • Colormap in MATLAB
    • MATLAB Plot Colors
    • MATLAB fplot()
    • MATLAB Stacked Bar
    • MATLAB sphere()
    • MATLAB cylinder()
    • MATLAB mesh()
    • Pie Chart in MATLAB
    • MATLAB Gradient
    • Grid on MATLAB
    • Repmat in MATLAB
    • dlmread in MATLAB
    • Meshgrid in MATLAB
    • MATLAB Struct
    • MATLAB Cross Product
    • MATLAB colorbar Label
    • MATLAB Save Variable
    • MATLAB Saveas
    • MATLAB Cell Array
    • Polynomial in MATLAB
    • ismember MATLAB
    • Heaviside MATLAB
    • MATLAB rref
    • MATLAB polyfit()
    • MATLAB xlim
    • MATLAB Variance
    • Optimset MATLAB
    • Quiver MATLAB
    • Newton Raphson MATLAB
    • Mat2cell MATLAB
    • Magnitude MATLAB
    • format long MATLAB
    • Dot Product MATLAB
    • Jacobian MATLAB
    • What is Matlab?
    • Convolution MATLAB
    • Moving Average MATLAB
    • Fourier Series MATLAB
    • Gaussian Fit MATLAB
    • Bisection Method MATLAB
    • Laplace Transform MATLAB
    • Fourier Transform MATLAB
    • Signal Processing MATLAB
    • MATLAB Forms
    • Complex Conjugate MATLAB
    • MATLAB Write to File
    • uigetfile MATLAB
    • MATLAB Toolbox
    • MATLAB Errorbar
    • MATLAB Index Exceeds Matrix Dimensions
    • Nyquist MATLAB
    • Impulse Response MATLAB
    • xlsread MATLAB
    • MATLAB xlswrite
    • Matplotlib Scatter
    • MATLAB Import Data
    • MATLAB Export Data
    • MATLAB Read CSV
  • Basic
    • MATLAB Area Under Curve
    • MATLAB not equal
    • MATLAB max
    • MATLAB exist
    • MATLAB Table
    • MATLAB regression
    • MATLAB Lists
    • MATLAB quantile
    • MATLAB Round
    • MATLAB readtable
    • MATLAB disp
    • MATLAB Standard Deviation
    • MATLAB quadprog
    • MATLAB Transpose
    • Introduction to MATLAB
    • Advantages of MATLAB
    • MATLAB Features
    • Taylor Series MATLAB
    • MATLAB Z Transform
    • fsolve in MATLAB
    • MATLAB QR
    • Career in MATLAB
    • Uses Of MATLAB
    • MATLAB Free
    • How to Install MATLAB
    • How to Use MATLAB?
    • MATLAB Version
    • MATLAB Compiler
    • MATLAB Commands
    • MATLAB Block Comment
    • MATLAB? sprintf
    • MATLAB fprintf
    • Data Types in MATLAB
    • MATLAB Integral
    • MATLAB Double Integral
    • MATLAB boolean
    • MATLAB vpa
    • MATLAB Object
    • MATLAB Annotation
    • MATLAB Variables
    • MATLAB Global Variables
    • MATLAB Operators
    • MATLAB Logical Operators
    • MATLAB nan
    • MATLAB Patch
    • MATLAB AND Operator
    • MATLAB OR Operator
    • Vectors in MATLAB
    • What is Simulink in MATLAB
    • MATLAB Interpolation
    • MATLAB Imread
    • fscanf MATLAB
    • Euler Method MATLAB
    • Root Locus MATLAB
    • MATLAB return
    • Bode Plot MATLAB
    • Nargin MATLAB
    • MATLAB Matrix Inverse
    • MATLAB String to Number
    • MATLAB string
    • MATLAB ColorBar
    • MATLAB Surfc
    • MATLAB Concatenate
    • NUMEL MATLAB
    • MATLAB? File Extension
    • MATLAB File
    • MATLAB Smooth
    • MATLAB ones
    • Exponential in MATLAB
    • MATLAB ksdensity
    • MATLAB log
    • MATLAB Append
    • MATLAB hold on
    • MATLAB Magnitude of Vector
    • Heatmap in MATLAB
    • MATLAB xticks
    • MATLAB randn
  • Control Statements
    • IF-Else Statement in MATLAB
    • If Statement in MATLAB
    • Loops in MATLAB
    • For Loop in MATLAB
    • While Loop in MATLAB
    • do while loop in MATLAB
    • Nested Loop in MATLAB
    • Switch Statement in MATLAB
    • Break in MATLAB
  • Functions
    • MATLAB Functions
    • MATLAB user defined function
    • Calling Functions in MATLAB
    • Transfer Functions in MATLAB
    • Anonymous Functions in MATLAB
    • Inline Functions in MATLAB
    • Bessel Functions in MATLAB
    • Mean Function in MATLAB
    • Find Function MATLAB
    • Filter Function in MATLAB
    • IIR Filter MATLAB
    • Piecewise Function in MATLAB
    • Sum Function in MATLAB
    • Simulink MATLAB Function
    • MATLAB Create Function
    • MATLAB Inverse Function
    • MATLAB Count
    • Step Function MATLAB
    • MATLAB limit
    • Fminsearch in MATLAB
    • Covariance in MATLAB
    • Summation in MATLAB
    • Linear Fit MATLAB
    • MATLAB?linear regression
    • MATLAB Derivative
    • MATLAB Derivative of Function
    • MATLAB Comet()
    • Fzero MATLAB
    • xlabel MATLAB
    • Matplotlib Legend
    • Matplotlib Subplots
    • Plot graph MATLAB
    • MATLAB Format
    • MATLAB plot title
    • Multiple Plots in MATLAB
    • MATLAB Indexing
    • Ceil MATLAB
    • Curve Fitting MATLAB
    • MATLAB trapz()
    • MATLAB Normalize
    • MATLAB diff
    • MATLAB sym()
    • MATLAB Syms
    • Absolute Value MATLAB
    • MATLAB Exponential
    • Kalman Filter MATLAB
    • Low Pass Filter MATLAB
    • Bandpass Filter MATLAB
    • MATLAB Unique
    • Trapezoidal Rule MATLAB
    • MATLAB Root Finding
    • MATLAB stem()
    • MATLAB loglog()
    • MATLAB Autocorrelation
    • MATLAB Sort
    • Simplify MATLAB
    • Cumsum MATLAB
    • Eval Function MATLAB
    • Polyval MATLAB
    • MATLAB Colon
    • MATLAB Eigenvalues
    • MATLAB fit
    • Delta Function MATLAB
    • MATLAB Remainder
    • Differentiation in MATLAB
    • Permute MATLAB
    • isempty MATLAB
    • MATLAB text()
    • MATLAB Display Text
    • Varargin in MATLAB
    • MATLAB gca
    • MATLAB fill()
    • MATLAB pcolor()
    • MATLAB min
    • MATLAB xcorr
    • MATLAB? color codes
    • Semilogy MATLAB
    • MATLAB? eye
    • feval MATLAB
    • num2str in MATLAB
    • MATLAB Images
    • MATLAB Image? Segmentation
    • Imagesc MATLAB
    • MATLAB Image Processing
    • MATLAB Image Resize
    • MATLAB Flag
    • MATLAB fopen
    • Strcmp MATLAB
    • MATLAB fwrite
    • MATLAB fft()
    • MATLAB zeros()
    • MATLAB textread
    • Arctan MATLAB
    • MATLAB Scripts
    • Butterworth filter MATLAB
    • MATLAB Findpeaks
    • MATLAB find Index
    • MATLAB Cell
    • MATLAB Unit Step Function
    • MATLAB Backslash
    • MATLAB Mod
    • Size Function in MATLAB
    • Secant MATLAB
  • Matrix
    • Matrix in MATLAB
    • 3D Matrix in MATLAB
    • Transpose Matrix MATLAB
    • Sparse Matrix in MATLAB
    • Matrix Multiplication in MATLAB
    • Identity Matrix in MATLAB
    • MATLAB?writematrix
  • Programs
    • Square Root in MATLAB
    • Square Wave MATLAB
    • Squeeze MATLAB
    • Factorial in MATLAB
    • Cell to String MATLAB
  • Interview Questions
    • MATLAB Interview Questions

Related Courses

MATLAB Certification Course

R Programming Course

All in One Data Science Courses

Polar Plot in Matlab

By Priya PedamkarPriya Pedamkar

polar plot in matlab

Introduction to Polar Plot in Matlab

In this article, we will discuss on Polar Plot in Matlab. Plots are the way of showing the patterns or trend in a graphical way which are easy to understand and make the relevant business decisions. They can be a great help to the uninformed audience without or a little background knowledge about the subject. There are different types of plots that are used to show different patterns or trends. For example: If we want to show the distribution of a specific feature in a particular area then we can use the scatter plot. So, we can choose the type of plot depending on the business requirements.

Working of Polar Plot in Matlab

The polar plot is the type of plot which is generally used to create different types of plots like line plot, scatter plot in their respective polar coordinates. They are also helpful in changing the axes in the polar plots. In Matlab, polar plots can be plotted by using the function polarplot(). Please find the below syntaxes which explain the different properties of the polar plot:

  • P=polarplot (theta value, radius): This is used to plot the line in polar coordinates. Here theta value is the angle in radians format and radius is the radius value for each point. Inputs can be of any format like if the inputs are vector or matrices then they can be of the same size and equal length. If the input is in the form of a matrix, then the polar plot plots the line having radius value as columns and columns of theta value. Inputs can also be vector and matrix as long as they have equal size i.e. length of the vector should be equal to the dimension of a matrix.
  • P=polarplot (theta value, radius, line property): This syntax is used to change the property of the line style, color or symbol of the marker.
  • P=polarplot(theta value 1, radius 1,…, theta value n, radius N): This is used to plot multiple theta value and radius in pairs.
  • P=polarplot (radius value): This is used to plot the line with different spaced angles evenly within a range of 0 to 2π.
  • P=polarplot (radius value, specification of the line): We can change the line property, color and marker symbol of the line plotted.
  • P=polarplot(I): This is used to plot the complex values.
  • P=polarplot (I, line specification): We can change the line property, color and marker symbol of the line plotted.
  • P=polarplot(___, Name argument, Value argument): This is used to plot the line in the name-value pairs but the property we specify will apply to all the lines because we cannot set different properties for multiple lines.

Examples of Polar Plot in Matlab

In the following article, we will see the example of Polar Plot in Matlab.

Example #1

tvalue = 0:0.05:2*pi;
r = sin(tvalue).*cos(tvalue);
polar(tvalue,r)

Start Your Free Data Science Course

Hadoop, Data Science, Statistics & others

All in One Data Science Bundle(360+ Courses, 50+ projects)
Python TutorialMachine LearningAWSArtificial Intelligence
TableauR ProgrammingPowerBIDeep Learning
Price
View Courses
360+ Online Courses | 50+ projects | 1500+ Hours | Verifiable Certificates | Lifetime Access
4.7 (86,527 ratings)

Output:

Polar Plot in Matlab-1.1

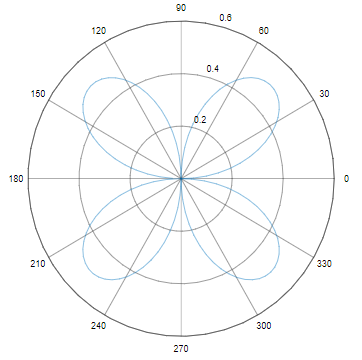
In the above example, this will plot the line in the respective polar coordinates. We should always give the theta value in terms of radians. If it is in degree, then we should convert it into radians by using deg2rad function in Matlab and use it in the plot. We can change the limits of the angle axis by using the thetalim function in Matlab. Radius values taken in the plot can be vector or matrix and the negative values are represented as zero. Radius values limits can be adjusted by using the rlim function in Matlab. There are various properties of polar plots in Matlab like:

  • We can change the line specification of the plotted line by using any particular specifier to change the marker symbol, color or type of line. We can use any property depending on the requirements, for example, we can only specify the marker symbol and not the line then the plot will show only the symbol of the marker that we have chosen. There are different line styles which are used to change the appearance of the polar plot like ‘-.’ Is for dashed-dotted line,’:’ is for the dotted line.’- – ‘is used to show dashed line and ‘- ‘is used for solid line style.

Example #2

tvalue = 0:0.05:2*pi;
r = sin(tvalue).*cos(tvalue);
polar(tvalue,r,’g’)

Output:

Polar Plot in Matlab-1.2

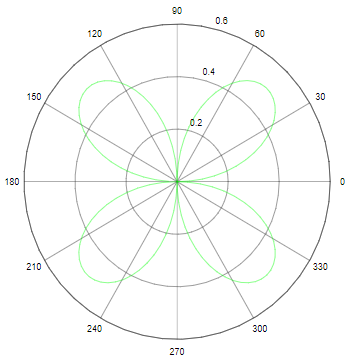
In the above example, it will plot a line in the polar coordinates and it will be green in color since we have mentioned the color property.

  • We can change the color of the line with the different values by mentioning the colors or RGB triplet values. RGB value denotes the intensities of the Red, Green, and Blue which decided the resulting color of the line. The color can be Yellow, Red, Green, Blue, Cyan, Magenta, White, Black and none. We can also customize the thickness of the line by specifying the value in its line width property. The values can be any positive value with 0.5 widths being the default value.
  • Marker symbols are one of the main properties while plotting. They can be of any shape and size according to the input that we provide. They are helpful in distinguishing the different line patterns and trends if we specify them with different marker symbols. Marker symbols can be a circle, point, asterisk, plus sign, cross, square, diamond, triangle, etc. By default, the plotted line does not have any markers, we have to specify the marker symbol while writing the commands for it.

Example #3

tvalue = 0:0.05:2*pi;
r = sin(tvalue).*cos(tvalue);
polar(tvalue,r,’o’)

Output:

Example -1.3

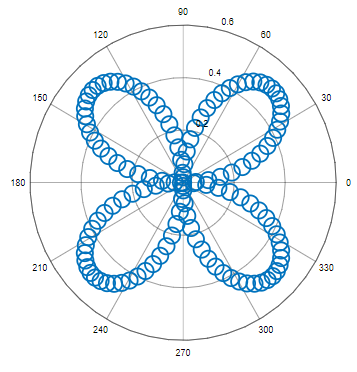
In the above example, this will plot the line with the marker symbol as a circle. We can also change the maker size by providing any positive value to it and we can also change the marker face color which again can be of different face colors.

  • We can customize the theta values, radius values, grid lines, theta axis units’ values, theta axis grid color, labels of the plot and the legend which is associated with different axes.

Conclusion

There are different plots that can be plotted with the help of polar plots like histogram, line and scatter plot but in the above part, we have discussed the customization of line plots using the polar coordinates. Similarly, other plots can also be plotted and customized in the same way.

Recommended Articles

This is a guide to Polar Plot in Matlab. Here we discuss the Introduction and working of polar plot in Matlab along with different examples and its syntax. You may also look at the following articles to learn more –

  1. Grid Lines in Matlab
  2. Understanding Matplotlib in Python
  3. Natural Log in Matlab with Examples
  4. Various Operations of Arrays in Matlab
  5. Various Operations of Legend in Tableau
  6. Working of Matlab Legend with Examples
Popular Course in this category
MATLAB Training (3 Courses, 1 Project)
  3 Online Courses |  1 Hands-on Project |  8+ Hours |  Verifiable Certificate of Completion
4.5
Price

View Course

Related Courses

R Programming Training (13 Courses, 20+ Projects)4.9
All in One Data Science Bundle (360+ Courses, 50+ projects)4.8
0 Shares
Share
Tweet
Share
Primary Sidebar
Footer
About Us
  • Blog
  • Who is EDUCBA?
  • Sign Up
  • Live Classes
  • Corporate Training
  • Certificate from Top Institutions
  • Contact Us
  • Verifiable Certificate
  • Reviews
  • Terms and Conditions
  • Privacy Policy
  •  
Apps
  • iPhone & iPad
  • Android
Resources
  • Free Courses
  • Database Management
  • Machine Learning
  • All Tutorials
Certification Courses
  • All Courses
  • Data Science Course - All in One Bundle
  • Machine Learning Course
  • Hadoop Certification Training
  • Cloud Computing Training Course
  • R Programming Course
  • AWS Training Course
  • SAS Training Course

ISO 10004:2018 & ISO 9001:2015 Certified

© 2022 - EDUCBA. ALL RIGHTS RESERVED. THE CERTIFICATION NAMES ARE THE TRADEMARKS OF THEIR RESPECTIVE OWNERS.

EDUCBA
Free Data Science Course

SPSS, Data visualization with Python, Matplotlib Library, Seaborn Package

*Please provide your correct email id. Login details for this Free course will be emailed to you

By signing up, you agree to our Terms of Use and Privacy Policy.

EDUCBA Login

Forgot Password?

By signing up, you agree to our Terms of Use and Privacy Policy.

EDUCBA
Free Data Science Course

Hadoop, Data Science, Statistics & others

*Please provide your correct email id. Login details for this Free course will be emailed to you

By signing up, you agree to our Terms of Use and Privacy Policy.

EDUCBA

*Please provide your correct email id. Login details for this Free course will be emailed to you

By signing up, you agree to our Terms of Use and Privacy Policy.

Let’s Get Started

By signing up, you agree to our Terms of Use and Privacy Policy.

This website or its third-party tools use cookies, which are necessary to its functioning and required to achieve the purposes illustrated in the cookie policy. By closing this banner, scrolling this page, clicking a link or continuing to browse otherwise, you agree to our Privacy Policy

Loading . . .
Quiz
Question:

Answer:

Quiz Result
Total QuestionsCorrect AnswersWrong AnswersPercentage

Explore 1000+ varieties of Mock tests View more