Updated May 31, 2023
Introduction to Surface Plot in Matlab
Plots are the means to show the distribution of the data graphically. If the plots are plotted properly then it shows a lot of relevant information to the uninformed audience about the significance of the plot. Sometimes, if the numbers are huge, then it is impossible to show it in the graph or plot. There are plots for the above scenario which are known as Surface plots and are used in visualizing the matrices if the range is too large to display it in the normal plot. In this topic, we are going to learn about Surface Plot in Matlab.
Working of Surface Plot in Matlab with Syntax
In Matlab, surface plots can be done with the help of keyword “surf” with different arguments that serve various properties in the plot. There are different surface plots that can be created using Matlab.
Please find the below syntax with arguments used for plotting the surface plot:
- surf (e, f, g): This is used to create a three-dimensional plot where that can have different colors and properties. The values in matrix g can be implemented to plot the heights which is top of the grid as mentioned in e and f plotted in e-f plane. There are different colors for different values of g and it will be plotted as part of the surface plot.
- surf (e, f, g, C): This will plot the surface plot as described in the above syntax. C in the input argument is used to specify the color of the surface plot.
- surf(g): This is used to plot the surface plot with the values mentioned in the rows and columns of the matrix as given in g.
- surf (g, C): This will plot the surface plot as described in the above syntax. C in the input argument is used to specify the color of the surface plot.
- surf (axes value, __): This syntax is used to implement the surface plot with the given axes value instead of the current axes value and it should be mentioned as the first input argument.
- surf (___, Name of the command, the value of it): This syntax is used to plot the surface plot with respect to the property that we can mention in the command section and provide the value as required.
Examples
Here are the following examples mention below
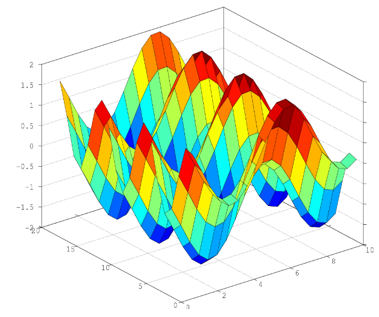
Example #1
[a, b] =meshgrid(1:0.5:10,1:20);

C = cos(a) + sin(b);

surf(a,b,C)
Output:
There are several properties related to the surface plot which can change the look and feel of the surface plots.
Please find the list of properties which are used in Matlab:
- We can change the face color of each face depending on the values we give to the CData property of the surface plot. The values can be flat, RGB triplet value, texture map, interp, etc.RGB triplet values are unique for all the colors which provide the intensity levels of colors Red, Green, and Blue. The intensity level of the RGB triplet is in the range of [0,1]. The colors can be Red, Blue, Green, magenta, cyan, black, yellow, white and they have unique RGB values.
- We can also change the Face Alpha value of each surface. The values can be a scalar, flat, interp, texturemap. If the input is scalar then it ranges from 0 to 1, 0 being completely opaque and 1 is fully transparent. The values between 0 and 1 can be semitransparent. 1 is the default value for face alpha.
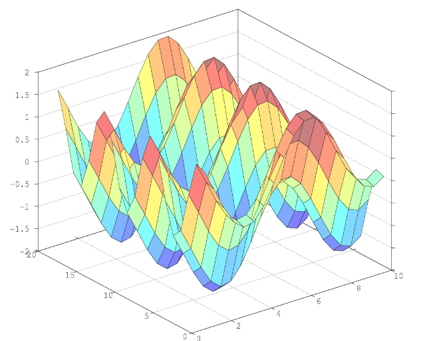
Example #2
[a, b] =meshgrid(1:0.5:10,1:20);

C = cos(a) + sin(b);

surf(a,b,C,'FaceAlpha',0.5)
Output:
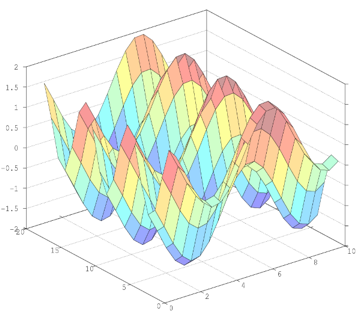
Example #3
[a, b] =meshgrid(1:0.5:10,1:20);

C = cos(a) + sin(b);

surf(a,b,C,'FaceAlpha',0.4)
Output:
- We can also modify the lighting of each face on the surface. The values that we can provide to the input argument are flat, Gouraud and none. If the value is flat, then the light is applied to each face uniformly and if the value is Gouraud then the light is changed across each face of the surface and if it none then no light is applied.
- We can also change the alignment to sharpen the vertical and horizontal edges of the plot. The values for this property can be OFF or ON. If the input of this property is OFF, then the edges of the plot will not be sharpened which will provide an uneven finish while if it is ON, then the horizontal and vertical edges will be sharpened to provide a smooth finish to the plot.
- We can also change the lighting of the horizontal and vertical edges. The values that we can provide to the input argument are flat, Gouraud and none. If the value is flat, then the light is applied to each face uniformly and if the value is Gouraud then the light is changed across each face of the surface and if it none then no light is applied.
- There are various properties that are related to marker, coordinate date, normal, lighting methods, legend, interactivity, callbacks, and identifiers. All the properties have their own functions and they can be used to change various properties of surface plots.
Conclusion
Surface plots are used in the graphical illustration of the numerical quantities that are very huge and is not possible to implement in the normal plot. So, it is essential to learn about these plots as we face the above scenario in all the business requirements.
Recommended Articles
This is a guide to Surface Plot in Matlab. Here we discuss the examples and working of Surface Plot in Matlab with Syntax. You can also go through our other suggested articles to learn more –
