Updated March 24, 2023

Introduction to Log Plot Matlab
Log Plots are the two-dimensional graphs that have a logarithmic scale in both horizontal and vertical axes. Logarithms can be written as the inverse of an exponential equation. The most common base of any logarithmic equation is always considered to be 10 if it is not specified. Logarithmic plots are used to estimate various numerical parameters and also used in the field of economics. Logarithmic plots are mainly used for plotting the positive real numbers and plotting negative numbers will not result in any solution. In this topic, we are going to learn about Log Plot Matlab.
Working with Log Plot Matlab
In Matlab, we use a log plot to plot the graphs in logarithmic scales in both horizontal and vertical axes. There are various syntaxes that are used to plot the numbers based on their nature whether it is a real or complex number.
Please find the below syntax and their use:
- Loglog(X): This plots the logarithmic scale with respect to the columns present in X and their index provided that it is a real number. If the value is a complex number, then it ignores the imaginary component of it and plots the graph with respect to the real component of the number.
- LogLog (a1, b1…): This plots the logarithmic values in terms of different pairs present in a1 and b1. It any one of them an or bn is a matrix, then it is meant to plot the vector argument of it and the values present in the matrix with their dimension.
- Loglog (a1, b1, linespeci…): This plots the logarithmic values according to the specifications that we give to the line. Here, linespeci denotes the properties of the line including color, line type, etc.
- Loglog (….’name of the property’, ‘value of the property’): This is meant to change the line properties. There are various formulas and syntax that can be performed with lines like to change the line type and color.
- Loglog (axes,…): This plots the graph with the axes value as mentioned by the “axes” label in the syntax.
There are various properties of lines that can be changed according to the values that we provide during the syntax like color, color mode, line width, style of the line, line join and aligning different vertex centers.
- Line color can be red, blue-green, cyan, magenta, yellow, black, white and no color. Each color has its unique hexadecimal color code and RGB Triplet which are given by values 0 and 1. In Matlab, they have their unique RGB triplet and hexadecimal color which are used while plotting the graphs.
- There are two color modes that can be assigned according to the requirements. If it is set to “auto” Matlab changes the color of the line automatically. If it is set to “manual” then we can manually change the color of the line by specifying the value in “line spec” argument. If we have set any value in the “line spec” argument, then the color mode is changed to manual.
- There are various line styles that can be changed as per the business requirement. If the line style is ‘- ‘then it is the solid line if the style is ‘- – ‘then it is known as a dashed line if the style is ‘..’ then it is known as a dotted line and if the style is ‘-.’ then it is known as a dashed-dotted line.
- There are two types of line style mode which have the same working mechanism as that of color style mode. If the line style mode is set to auto, then Matlab decides the mode of the line while if it set to manual then we have to specify the style mode of the line in its line style property. If we have already specified, the line style mode in its specification while plotting the log plot then it is by default assigned to “manual “.
- Line widths can also be adjusted for proper edges of the line.
- We can also adjust the line corners style which can be round, chamfer and miter.
- We can also set the vertex to align parameter to Off or On. If it is Off, then vertical and horizontal lines will not be sharpened enough which shows an uneven appearance of the line. If it is On, then the vertical and horizontal lines are sharpened which shows an even appearance of the lines.
Examples of Log Plot Matlab
Here are the examples of Log Plot Matlab mentioned below:
Example #1
To plot the logarithmic scale in both the axis:
a = logspace (-2,1)

b= exp(a)

loglog(a,b)
Output:
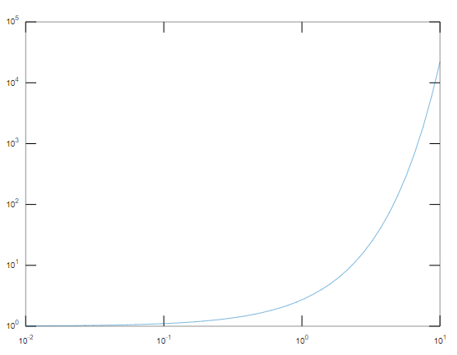
This plots the logarithmic scale in the x and y-axis. In the x-axis, it ranges from 10^-2 to 10^1 and the graph is plotted according to the above plot.
Example #2
a = logspace ( -3,2)

b= exp(a)

loglog(a,b)
Output:
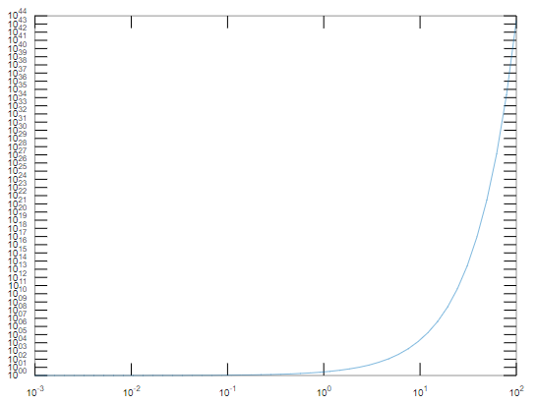
This plots the logarithmic scale in the x and y-axis. In the x-axis, it ranges from 10^-3 to 10^2 and the graph is plotted according to the above plot.
Semilogx is used to plot the logarithmic values in the x-axis only with y having the linear values.
It is given by the below syntax:
- semilogx(a): This will plot the logarithmic values for the x-axis and the linear values in Y-axis.
- semilogx (a1, b1…): This plots the logarithmic values in x in terms of different pairs present in a1 and b1. It any one of them an or bn is a matrix, then it meant to plot the vector argument of it and the values present in the matrix with their dimension.
- semilogx (a1, b1, linespeci…): This plots the logarithmic values in the x-axis according to the specifications that we give to the line. Here, linespeci denotes the properties of the line including color, line type, etc.
Example #3
a= 0: 10000

b = log(a)

semilogx(a,b)
Output:
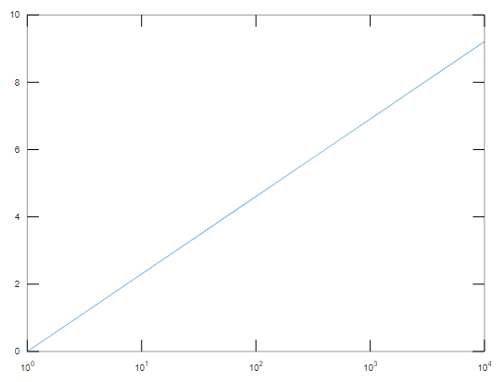
It will plot the logarithmic values in the x-axis ranging from 10^0 to 10^4.
Conclusion
Log plots are used in the field of economics, to estimate the numerical parameters and in the field of machine learning to transform the columns if they are not normally distributed. So, depending on the requirements we can use loglog and semilogx in Matlab.
Recommended Articles
This is a guide to Log Plot Matlab. Here we discuss the introduction and working with Log Plot Matlab along with the examples and outputs. You may also have a look at the following articles to learn more –
