Updated June 14, 2023
Introduction to PERT Charts for Dummies
PERT Charts – Efficiently managing the projects you’re in charge of is key within program management to achieve the desired results for the management and the business as a whole. To do that, there are many different tools and techniques available that can be chosen as per the requirements set by the program. In the case of any project, the PERT tool often proves to be quite efficient for use and can be utilized in many ways possible. PERT has made organizing and scheduling projects much more accessible, whether initiating multiple projects or an extensive program.
PERT uses the concept of PERT charts as its main component for managing and scheduling individual tasks and activities within projects. Project and program managers effectively use PERT charts to facilitate easy and optimum maneuvering of their respective projects and programs. In this article, let’s unravel the truth about PERT charts and how PERT charts work to bring order and accurate forecasting for our projects and programs.
What is PERT?
Harold Kerzner has very accurately mentioned in his book Project Management that.
“Program Evaluation Review Technique, or simply PERT, is a management planning and control tool. It can be easily considered a road map for a particular program or project, where all the major elements (or events) have been completely identified, along with their corresponding inter-relations.”
In simple terms, the designers of PERT created a statistical project management tool to analyze and diagrammatically represent the tasks involved in achieving project completion.
Commonly used in conjunction with the Critical Path Method (CPM), PERT ensures that a program/project manager can accurately judge the project’s schedule and how much time each task or activity would occupy in the scheme of the entire project life cycle.
PERT estimates the time each activity within a project would take and hence, calculates, based on PERT charts analysis, the minimum and maximum time of completion of the entire project. This tool was the first one of its kind to simplify the process of determining the project’s time and schedule without knowing the specifications and duration of the activities involved.
People mostly use PERT in projects focusing on time rather than the budget allotted because PERT is an event-oriented technique. Apart from time-dominated scenarios, PERT can be undertaken in particularly large-scale, one-time, non-routine projects that are complex. These scenarios always encounter a higher success rate.
Henry Ford successfully implemented PERT in the mass production of automobiles back in the 1920s, and people even used this approach/tool in the 1968 Winter Olympics held in Grenoble.
PERT considered all the statistical data available for a manufacturing line and would then enable the project manager to count down to the time each activity would require. Through the years, managers were able to cascade this type of approach to fuel the smooth functioning of business and software development projects.
Project/program managers often construct PERT charts with the end in mind, working from the back to the front of the project, as they determine project end dates first and then work their way up.
What will you Find in PERT?
In this section, we will go through a range of PERT terminologies used during the implementation, so you can have a good idea of the elements involved before we get to its working.
A PERT chart, as you know, presents a graphical representation of a project in the form of network diagrams. Here is what each aspect of the network diagram is supposed to mean to you:
- PERT Events: These diagrams consist of nodes, which represent events. These events are project milestones. They can either denote the start of a task or the completion of one. These events don’t consume any time or resources and mark the event in its action. It is denoted as follows:
![]()
Note: We consider an event completed only after completing all the activities leading up to it.
- Predecessor event: This event can be termed as an event that immediately precedes another event without any other event.
Note: One event can be the predecessor event for multiple events with many predecessor events.
- Successor event: This event can be termed as an event that immediately succeeds another event without any other event.
Note: one event can be the successor event for multiple events and can have many successor events.
- PERT Activity: This can be described as the actual performance of a task. Activities consume time and resources (materials, space, labor, machinery) and represent the movement of time, effort, and resources from one event to another. This can be denoted as follows:

Note: A PERT Activity can’t be performed until a predecessor event has been completed.
- PERT Subactivity: To make activity management easier for the manager, they can create subactivities from a PERT activity, which can be further broken down into additional subactivities.
Note: Subactivities have the same properties as that activities.
- PERT Dependent Activity: Dependent activities don’t require resources to complete the task.
- Optimistic Time (OT): This is the minimum possible time needed to complete a particular task or a path from one event to another, assuming that everything proceeds better than expected. This is the best-case scenario.
- Pessimistic Time (PT): By assuming that everything goes wrong or gets delayed (not considering natural disasters), one can determine the maximum possible time needed to complete a particular task or path from one event to another, representing the worst-case scenario.
- Most Likely Time (MT): Assuming everything goes normal, one can determine the best estimated time to complete an activity or transverse a path.
- Expected Time (ET): We make our best estimate of the time needed to complete an activity or traverse a path, accounting for the fact that things don’t always go as planned. We can denote this as follows:
ET = (OT + 4 x MT + PT) / 6
- Standard Deviation of Time: One can calculate the variability of the time taken for the completion of an activity or a path as follows:
= [( PT – OT ) / 6] 2
- Lead Time: This time indicates the completion of a predecessor event required to allow sufficient time for the activities that must occur just before a specific event can be accomplished.
- Lag time: The earliest time given to a successor event determines when it can follow a specific event.
- Critical Path: The most extended, continuous pathway from the first event to the terminal event of a project determines the total time in calendar days required for the project’s completion.
Note: any time delays occurring to reach the terminal event will delay the accomplishment of the terminal event by the same amount.
- Critical Activity: An activity with a total slack count equal to 0.
- Fast-tracking: This is when a project handles many critical activities in parallel.
- Slack: This is the measure of the excess time and resources that are available to complete a particular task. Positive slack would mean the task is ahead of schedule, whereas negative slack would mean behind schedule. Zero slack would indicate on schedule.
How Does it Work?
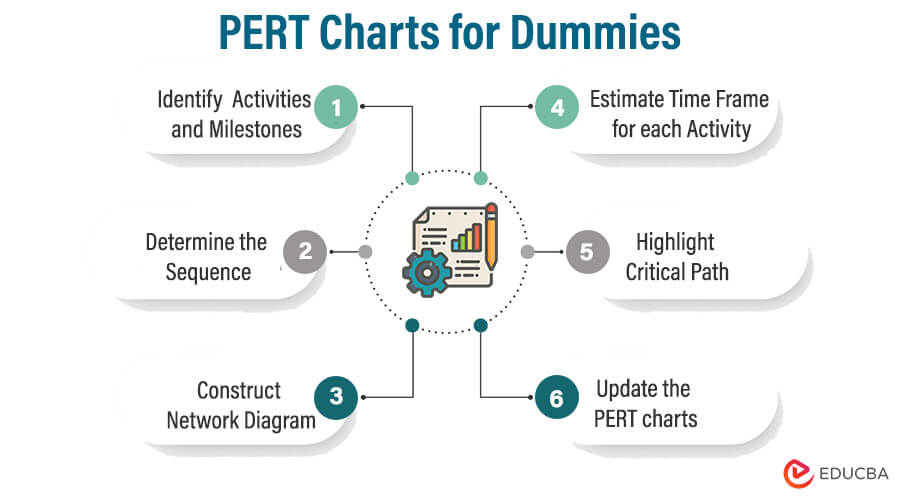
Listed below are the steps to be followed to have a successful PERT implementation:
- Please identify the activities to be undertaken and the milestones to be achieved.
- Determine the sequence of these activities.
- Construct a network diagram.
- Estimate a possible timeframe for each activity.
- Highlight the PERT chart’s critical path.
- Update the PERT charts as the program progresses.
1. Identifying Activities and Milestones
You will need to chalk out the events and describe the activities that link one event with another. Once you’ve identified these entities, you can move one step closer to scheduling your project most accurately.
2. Determining the Sequence
Sequences can determine the path that your project needs to take. This sequence can also choose dependent events or activities that can occur alongside other events and activities. The analysis is essential to determine the correct series of these activities and events involved in the pathway.
3. Constructing a Network Diagram
Now with the needed information and the sequence, you can jot down a network diagram to help you understand the time sequences between events. This will give us an accurate picture of the stages and what will lead to the completion of the project.
4. Estimating Time Frame for Activity
We estimate the time for each activity at this stage and calculate it in weeks.
5. Highlighting the Critical Path
In this step, we add the time taken for each activity and determine the longest pathway. We highlight it and take the estimated time as the total time required for the project from start to end.
Once you know the approximate end date of the project, you can then add resources if you need the work completed earlier than expected.
6. Updating the PERT Charts
As the project progresses, you must update the PERT charts. The project can replace estimated times with actual times as it unfolds itself. This should be reflected in the PERT charts for the project to estimate accurate timelines and schedules.
PERT Analysis
For managers, peeking into PERT charts is like gaining complete knowledge about the proceedings of a project. Due to its schematic and diagrammatic representation, it becomes easier to read and understand.
The analysis of PERT charts will show the sequence of activities and events that we must undertake to complete the project. Based on this fact, it becomes easier for a manager to make decisions that involve removing resources from one activity and pushing them towards another, depending on the timeline and dependency factors for these events.
Knowing the PERT chart slack time is beneficial for making such movements while the project is ongoing and can help managers allocate resources accordingly. This takes care of a manager’s major undertaking, which is control. This benefit urges managers and analysts to ensure that the information and data fed into the PERT are accurate to obtain the output in a jiffy.
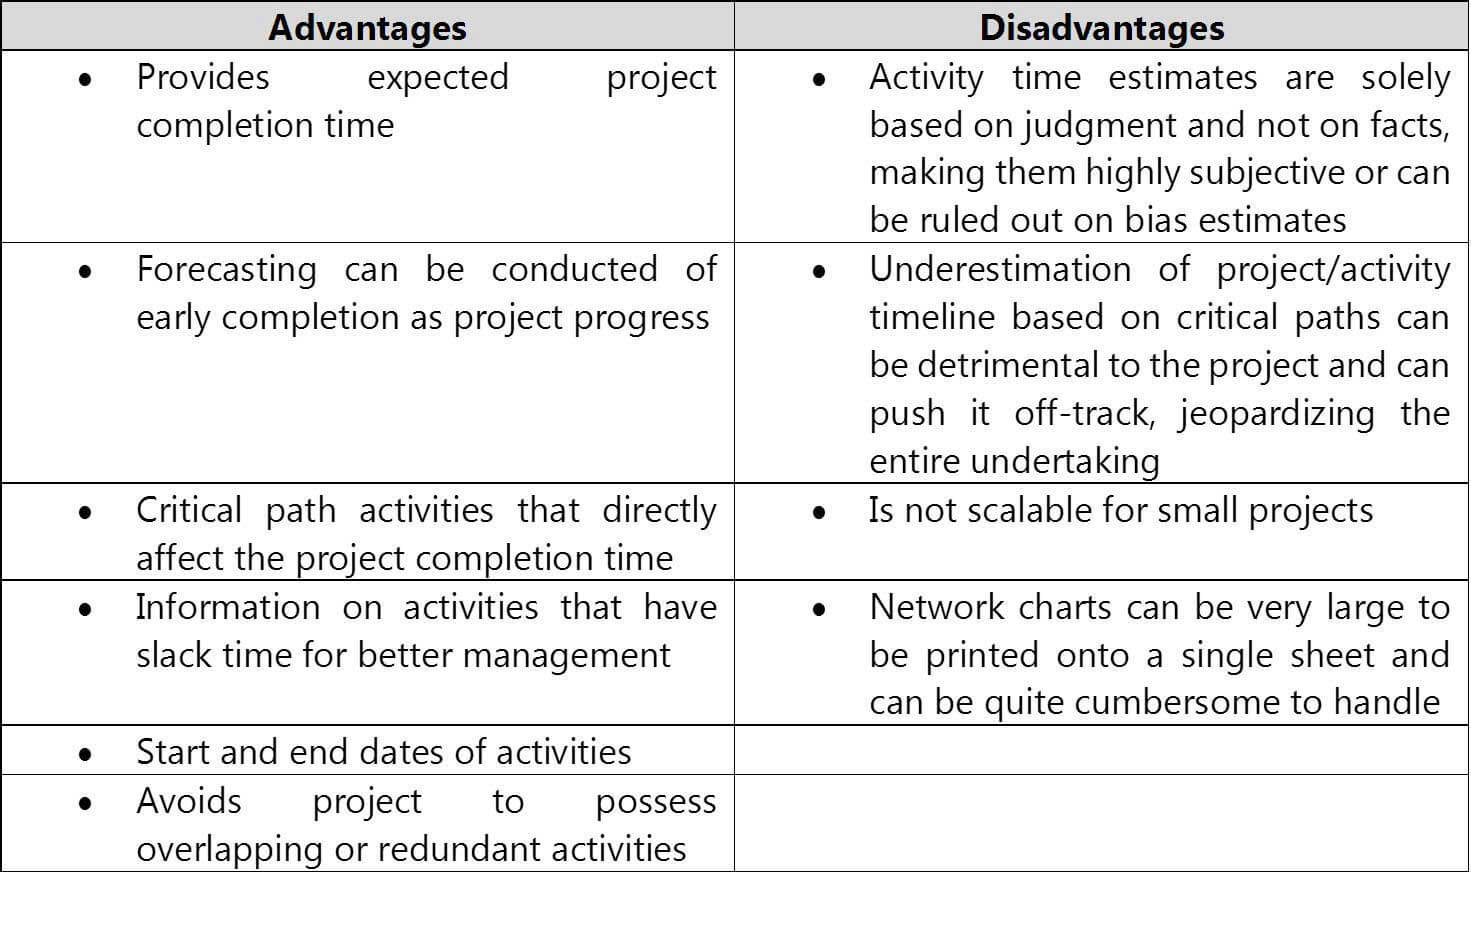
Pros and Cons
Each technique or tool has its own set of advantages and disadvantages. We should leverage the benefits of PERT charts while minimizing their disadvantages as much as possible. PERT has been ruling the project management scene for quite a long time now, and its integration with other commendable tools has turned tables like no other. Each tool has its nooks and crannies. I’ve jotted them down as follows:
As we end, I hope you have gained a lot that can help you plan and schedule projects more accurately at your workplace.
Check out the many articles that can help you with all your project management needs. Click on the Share button and spread the good news about this beautiful tool that can make scheduling easier. Happy Project Managing!
Recommended Articles
This has been a guide to PERT Charts for Dummies. Here we discussed the basic concept, working, and pert analysis, along with the pros & cons. You can also go through our other suggested articles to learn more –
