Updated March 23, 2023
Definition of Measures in Power BI
Measures in Power BI are used for defining the calculation. This is done using DAX Language (Data Analysis Expression). DAX calculates each value of each row. Whereas if we use such kind of functions in excel then we will be able to get only aggregate values. But in Power BI using DAX we can apply any type of function which we use in Excel, which can also be used in Power BI using Measures. In Power BI, we use Measure to calculate the different functions and perform different mathematical operations in DAX platform.
How to Create Measures in Power BI?
Function fx bar is the place where we will be writing our DAX code for Measures. And here can use all the function which we have seen in MS Excel. If we go in the Edit Query option after we upload the data, we will be able to see the function fx bar, which we already saw and used in MS Excel as shown below.
Example #1 – Measures Power BI
Here we have some sales data below in which the sale of electronic products such as Laptop, Desktop, Tablet and Mobile is given as shown below. So you can download the excel workbook from the below link which is used for this example.
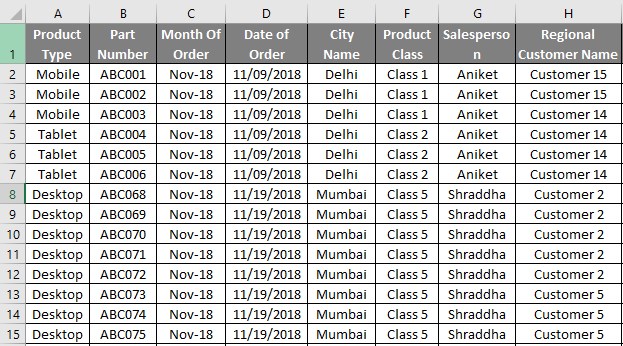
As we can see, major columns which are Product type, Product class, Unit Price and Quantity Sold. We will see using the above data and insert some new columns and apply Measures therein.
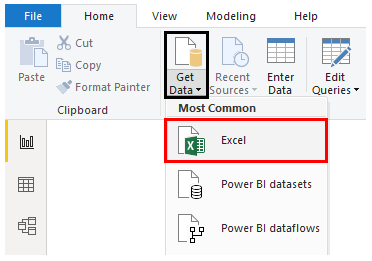
- For this, upload the data in Power BI. Go to Get Data option and select the source.
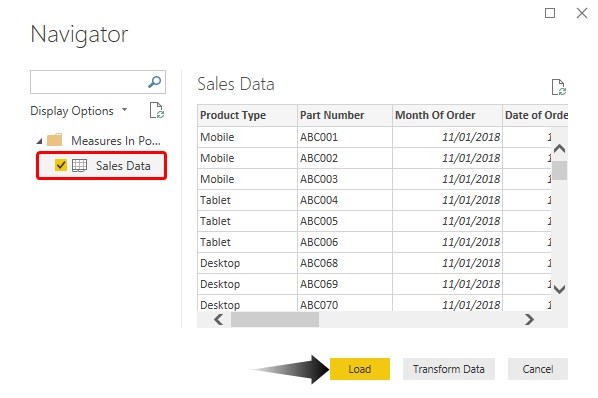
- Once we do that, browse the file location and open it. After that, we will get a Navigator window. In that select the sheet/s which we want to upload in Power BI. Here the sheet is named as Sales Data. Then click on Load.
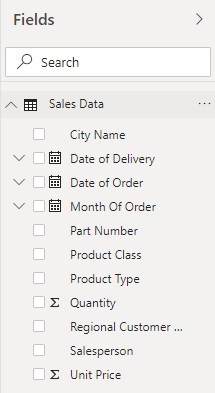
- We will be able to see the uploaded data in Power BI under the Fields section.
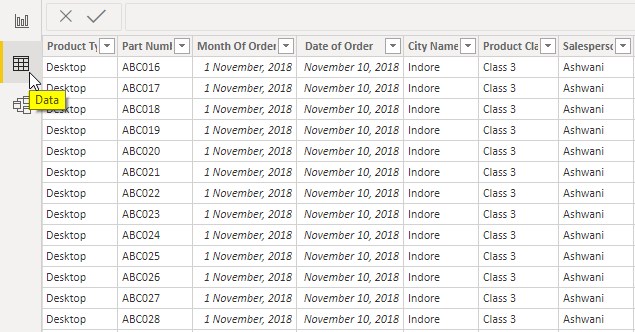
- And this will be visible also under Data tab as shown below.
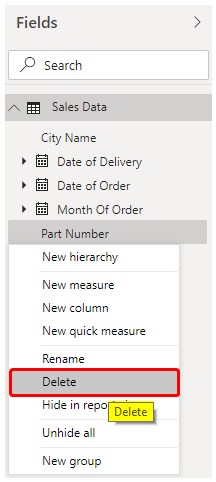
- Here we will delete the unnecessary columns from uploaded tables, such as Part Number column.
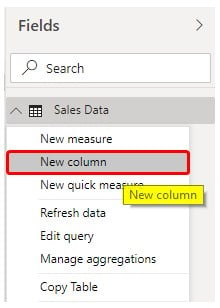
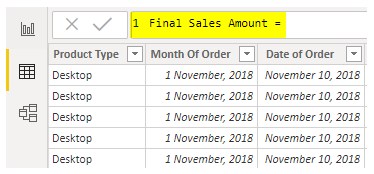
- Further, now let’s add another new column as Final Sales Amount. For this click anywhere on the table header and select New Column.
- Give the name which we want to newly inserted column. Here we have given the same which we have seen above, Final Sales Amount.
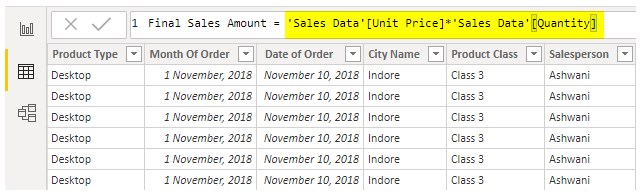
- Now in formula write the mathematical multiplication formula to where we will multiply Unit Price and Quantity to get Final Sales figures.
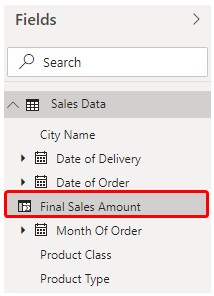
- We will be then able to see the name of a newly inserted column in Fields section.
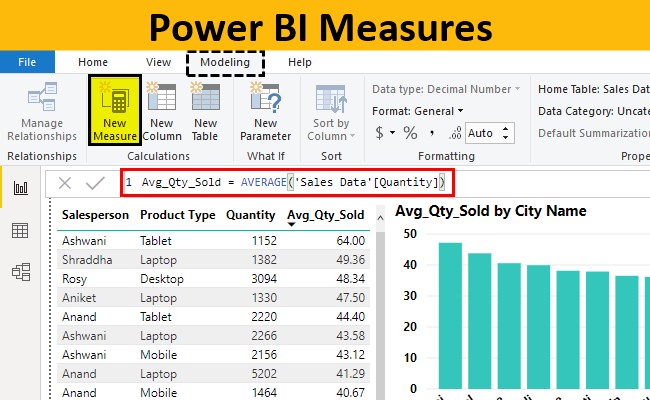
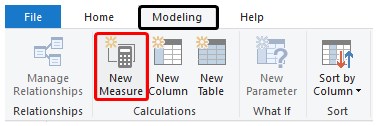
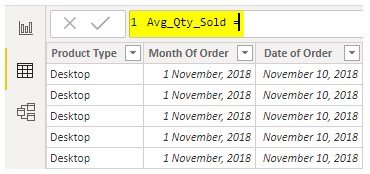
- Now we will create Measure, where we will add a measure for average quantity sold. For this, we can click Right as we did above and select Measure or else we can go to Modelling ribbon and select Measure from there.
- Here we will create a Measure for calculating Average quantity sold. And name then measure with such kind of name.
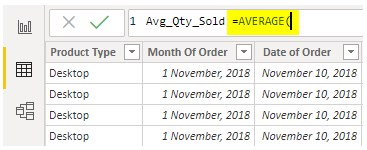
- Now use Average function just like we do in MS Excel.
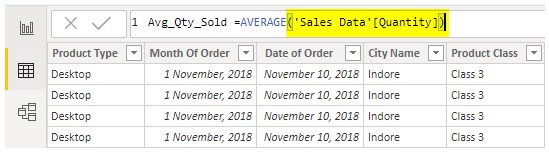
- And then select the column for which we need to calculate Average. Here are the measurable column will Quantity column of table Sales Data.
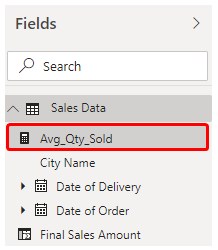
- Once done, then press enter. We will see, a new measure is created with the name Avg_Qty_Sold under Fields section as shown below.
We can change the name of created Measures by clicking 2 times on it in the Fields section easily if required.
Now next we will go to the Report tab and use all the created Measure and Calculated columns.
- Let’s use a Stacked Column Chart to compare to average quantities sold in each city.
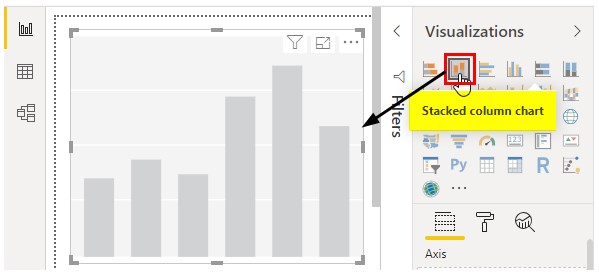
- For this, we will drag Avg_Qty_Sold into values and City Names into Axis as shown below.
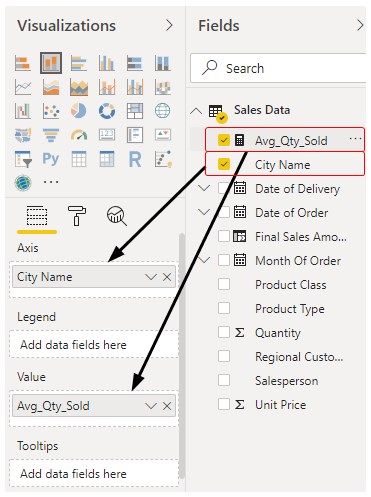
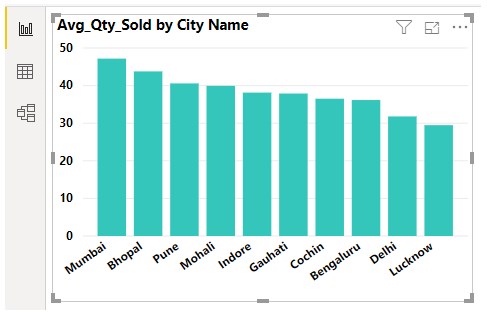
- We will see the plot where each city has its average quantity sold.
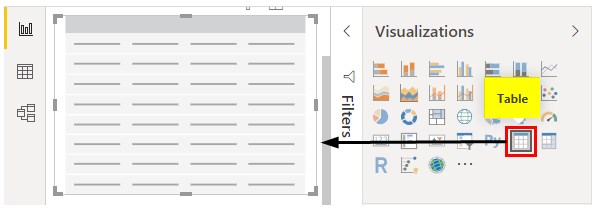
- Now we will create a Table chart. Where we will overall summary of Sales Data which we have uploaded. For this, select Table chart from the Visualization section.
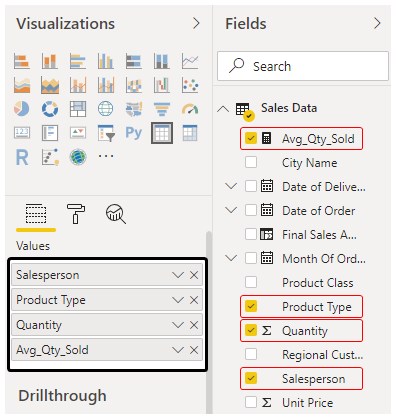
- Now to apply created fields in Table first we need to identify what we need to conclude. Here we will show, Salesperson wise how many products are sold and what was the average quantities were sold by each salesperson. For this, in sequence, we will drag the fields as shown below.
Then our Table we look like as shown below.
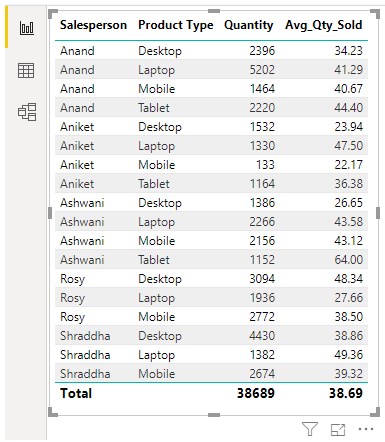
We can see, salesperson Ashwani has the highest average selling record which is 64.00 Qty. And salesperson Shraddha has given the highest sales figure among all the salespersons which is 4430.
This is how we have concluded and used create Fields and Measures for showing Average and Total sales product, city and salesperson wise.
NOTE: Power BI Measures file can also be downloaded from the link below and the final output can be viewed.
Pros of Measure In Power BI
- Measures are useful in creating various calculation tasks.
- We can apply all the MS Excel Insert function and Power BI function using Measure in Power BI.
- We can add any type of formula to create measures.
Things to Remember
- Before using Measures in Power BI, first, analyse and visualize what we need to find and conclude using create measures.
- Measure in Power BI is created using DAX mainly.
- Measures are not visible in a table but all the measures can be seen under the Fields section of the same table name.
- Measure carries the formula which eventually gives the output while we use them in any charts and visualizations.
Recommended Articles
This is a guide to Measures in Power BI. Here we discuss how to create measures in power bi to calculate different DAX function along with practical examples. You may also look at the following articles to learn more –
