Updated March 21, 2023
Introduction to Hierarchical Clustering in R
A hierarchical clustering mechanism allows grouping of similar objects into units termed as clusters, and which enables the user to study them separately so as to accomplish an objective, as a part of a research or study of a business problem, and that the algorithmic concept can be very effectively implemented in R programming which provides a robust set of methods including but not limited just to the function hclust() so that the user can specifically study the data in the context of hierarchical nature of clustering technique.
How does Clustering Work?
Clustering algorithms group a set of similar data points into clusters. The clustering algorithm’s main goal is to create clusters of data points that are similar in the features. In other words, data points within a cluster are similar, and data points in one cluster are dissimilar from data points in another cluster.
There are mainly two-approach uses in the hierarchical clustering algorithm, as given below:
1. Agglomerative
It begins with each observation in a single cluster. Then, the similarity measure in the observation further merges the clusters to make a single cluster until no farther merge possible; this approach is called an agglomerative approach.
2. Divisive
It begins with all observation in a single cluster and farther splits based on the similarity measure or dissimilarity measure cluster until no split possible; this approach is called a divisive method.
Now let’s start hierarchical clustering algorithms; hierarchical clustering can be performed top-down or bottom-up. We start with a bottom-up or agglomerative approach, where we start creating one cluster for each data point and then merge clusters based on some similarity measure in the data points. The next important point is that how we can measure the similarity. There are many distance matrix are available like Euclidean, Jaccard, Manhattan, Canberra, Minkowski etc., to find the dissimilarity measure. The choice of the distance matrix depends on the type of the data set available; for example, if the data set contains continuous numerical values, then the good choice is the Euclidean distance matrix, whereas if the data set contains binary data, the good choice is Jaccard distance matrix and so on.
Implementing Hierarchical Clustering in R
The steps required to perform to implement hierarchical clustering in R are:
1. Install all Required R Packages
We are going to use the below packages, so install all these packages before using:
install.packages ( "cluster" ) # for clustering algorithms

install.packages ( "tidyverse" ) # for data manipulation

install.packages ( "factoextra" ) # for clustering visualization

# includes package in R as –

library ( "cluster" )

library( "tidyverse" )

library( "factoextra" )
2. Data Preparation
The data Prepare for hierarchical cluster analysis; this step is very basic and important; we need to mainly perform two tasks here that are scaling and estimate missing value. The data must be scaled or standardized, or normalized to make variables comparable. The scaled or standardized or normalized is a process of transforming the variables such that they should have a standard deviation of one and mean zero.
If any missing value is present in our data set, then it is very important to impute the missing value or remove the data point itself. There are different options available to impute the missing value like average, mean, median value to estimate the missing value. For example, we use here iris built-in dataset, in which we want to cluster the iris type of plants; the iris data set contain 3 classes for each class 50 instances. It contains 5 features as Sepal. Length, Sepal.Width, Petal.Length, Petal.Width and Species.
The R code:
data <- iris

print(data)

# the sample of data set showing below which contain 1 sample for each class
“Sepal.Length” “Sepal.Width” “Petal.Length” “Petal.Width” “Species”
1 4.9 3.5 1.3 0.2 setosa
51 7.0 3.1 4.5 1.3 Versicolor
101 6.3 3.2 6.0 1.9 Virginia
data <- na.omit(data) # remove missing value

data <- scale(df) # scaling the variables or features
3. Specify which Hierarchical Clustering Algorithms using
The different types of hierarchical clustering algorithms as agglomerative hierarchical clustering and divisive hierarchical clustering, are available in R. The required functions are –
- Agglomerative hierarchical clustering (HC): hclust function, which is available in stats package, and Agnes function, which is available in cluster package] for
- Divisive hierarchical clustering: Diana function, which is available in cluster package.
4. Computing Hierarchical Clustering
The distance matrix needs to be calculated, and put the data point to the correct cluster to compute the hierarchical clustering. There are different ways we can calculate the distance between the cluster, as given below:
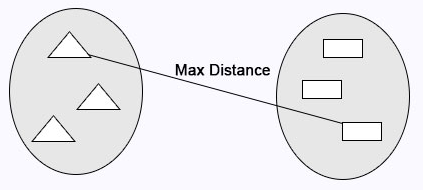
Complete Linkage: Maximum distance calculates between clusters before merging.
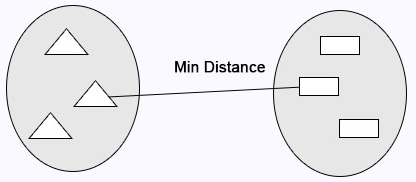
Single Linkage: Minimum distance calculates between the clusters before merging.
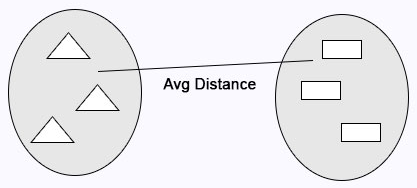
Average Linkage: Calculates the average distance between clusters before merging.
R code:
cluster <- hclust(data, method = "average" )
Centroid Linkage: The distance between the two centroids of the clusters calculates before merging.
R code:
# matrix of Dissimilarity

dis_mat <- dist(data, method = "euclidean")

# Hierarchical clustering using Complete Linkage

cluster <- hclust(data, method = "complete" )

#  or Compute with agnes

cluster <- agnes(data, method = "complete")
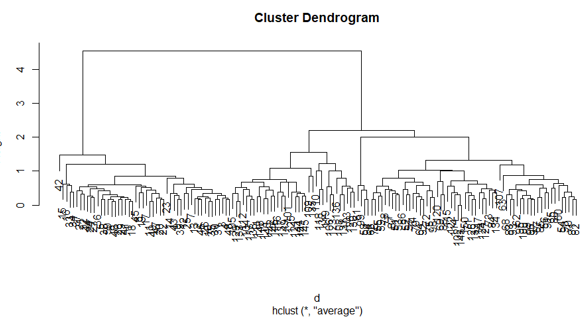
5. Dendrograms
The dendrogram is used to manage the number of clusters obtained. It performs the same as in k-means k performs to control a number of clustering. The current function we can use to cut the dendrogram.
R code:
cutree(as.hclust(cluster), k = 3)
The full R code:
ibrary(scatterplot3d)

data <- iris

print( data )

data <- na.omit(data)

data <- scale(data)

# matrix of Dissimilarity

dis_mat <- dist(data, method = "euclidean")

# creating hierarchical clustering with Complete Linkage

cluster <- hclust(data, method = "complete" )

# Dendrogram plot

plot(cluster)

# or agnes can be used to compute hierarchical clustering

Cluster2 <- agnes(data, method = "complete")

# Dendrogram plot

plot(cluster2)
The plot of the above R code:
Conclusion
There are mainly two types of machine learning algorithms supervised learning algorithms and unsupervised learning algorithms. Clustering algorithms are an example of unsupervised learning algorithms. Clustering algorithms groups a set of similar data points into clusters. There are mainly two-approach uses in the hierarchical clustering algorithm, as given below agglomerative hierarchical clustering and divisive hierarchical clustering.
Recommended Articles
This is a guide to Hierarchical Clustering in R. Here; we discuss how clustering works and implementing hierarchical clustering in R in detail. You can also go through our other related articles to learn more-
