Updated March 24, 2023

What is lm Function?
In this article, we will discuss on lm Function in R. lm function helps us to predict data. Let’s consider a situation wherein there is a manufacturing plant of soda bottles and the researcher wants to predict the demand of the soda bottles for the next 5 years. With the help of lm function, we can solve this problem. There is some information the researcher has to supply to this function to predict the output. In this problem, the researcher has to supply information about the historical demand for soda bottles basically past data.
The function will work on this past data/historical data and predict the values of the soda bottles. The number of bottles that the model has predicted, the manufacturing plant must have to make that number of bottles.
Let’s take another example of a retail store. Here the problem statement is that a store wants to estimate the demand for rice. Basically, the store wants to see how many packets they should stock in order to meet the demand. In this problem, the researcher first collects past data and then fits that data into the lm function. Lm function provides us the predicted figures. With the help of this predicted dataset, the researcher can take an effective call that how many rice packets they must stock in order to fulfill the demand.
Syntax:
lm(formula, data, subset, weights, na.action,

method = "qr", model = TRUE, x = FALSE, y = FALSE, qr = TRUE,

singular.ok = TRUE, contrasts = NULL)
Where,
The formula is a set of variables among which lm function needs to define. There is one dependent variable and can be multiple independent variables in this function. For example, variables can be distance and speed or Property rate, location, size of the property and income of the person.
- Data: It is a set data frame basically the environment from where the data is picked for the function.
- Subset: It is helpful when we have to pick specific observation from the data which we have to use in our lm function.
- Weights: It is an optional vector, it is used in the fitting process. Weights should be a numeric vector or NULL.
- Na.function: Na.functionis used when the researcher has to pass instructions like what to do when data has NA values in it.
- Method: It is used for the fitting process, the predefined method in syntax is “qr”.
- Model: It is a logical function, If it is TRUE then the corresponding components of the fit are returned.
- X: It is a logical function, If it is TRUE then the corresponding components of the fit are returned.
- Y: It is a logical function, If it is TRUE then the corresponding components of the fit are returned.
- qr: It is a logical function, If it is TRUE then the corresponding components of the fit are returned.
- singular.ok: It is also a logical function, it is false then the singular fit is an error.
Examples of lm Function in R
Let’s put some numbers in our above example.
Example #1
Problem Statement: There is a manufacturing plant of soda bottles and the researcher wants to predict the demand for soda bottles for the next 5 years.
Historical data of the last 20 years are mentioned below:
|
Year |
Sales(Number of bottles) |
| 2000 |
3310935 |
|
2001 |
5709184 |
| 2002 |
5274510 |
|
2003 |
5346064 |
| 2004 |
5866117 |
|
2005 |
3410297 |
|
2006 |
6280975 |
| 2007 |
3938247 |
|
2008 |
3393123 |
| 2009 |
3071252 |
|
2010 |
5176335 |
| 2011 |
7931652 |
|
2012 |
4793641 |
| 2013 |
4732211 |
|
2014 |
4349286 |
| 2015 |
6772890 |
|
2016 |
6966808 |
| 2017 |
3640308 |
|
2018 |
5502686 |
| 2019 |
6187610 |
Solution: Here we will make an lm function while using this historical data. Lm function provides us the regression equation, with the help of which we can predict the data.
Regression equation:
- β1: Intercept of The Regression Equation
- β2: Slope of The Regression Equation
- Y: Dependent Variable
- X: Independent Variable
For the convenience and making steps easy, we put the above data in the CSV file.
Syntax for the problem looks like:
soda_dataset = read.csv("lm function in R.csv", header = TRUE)>

lm_soda_dataset = lm(Sales~Year, data = soda_dataset)>

lm_soda_dataset
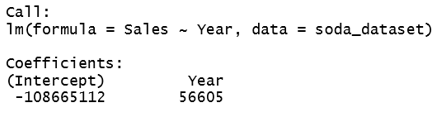
When we fit this input in the regression equation:
Sales = – 108665112 + 56605*Year
When we supply more data to this information we will get the predicted value out of it.
Example #2
Problem Statement: A retail store wants to estimate the demand for rice. Basically, the store wants to see how many packets they should stock in order to meet the demand. But before this, they will like to conduct some studies around the price of rice and demand for it. They have the last 10 years of data for both the price of rice and the demand of rice.
Historical Data:
| Year | Price | Demand |
| 2010 | 34 | 3459288 |
| 2011 | 36 | 5378760 |
| 2012 | 32 | 7996213 |
| 2013 | 45 | 5612215 |
| 2014 | 38 | 5379417 |
| 2015 | 46 | 5634967 |
| 2016 | 34 | 7650572 |
| 2017 | 42 | 4875672 |
| 2018 | 44 | 3788315 |
| 2019 | 49 | 6840814 |
Syntax:
rice_dataset = read.csv("lm function in R.csv", header = TRUE)>

lm_rice_dataset = lm(Demand~Price, data = rice_dataset)>

lm_rice_dataset
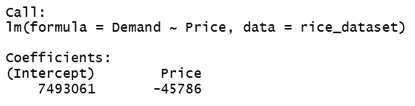
When we fit this input in the regression equation:
Demand= 7493061 – 45786*Price
When we supply more data to this information we will get the predicted value out of it.
Advantage of lm Function
Advantage of lm function is given below:
- It is a simple and powerful statistic function.
- One of the functions which helps the researcher/academicians/statistician to predict data.
- Helps us to take better business decision.
- It helps us to analyze the data.
- Helps us to rectify error if any.
Conclusion
lm function in R provides us the linear regression equation which helps us to predict the data. It is one of the most important functions which is widely used in statistics and mathematics. The only limitation with the lm function is that we require historical data set to predict the value in this function. But we can’t treat this as any limitation because historical data is a must if we have to predict anything. Historical data shows us the trend and with the help of a trend, we can predict the data.
Recommended Articles
This is a guide to the lm Function in R. Here we discuss the introduction and examples of lm function in R along with advantage. You may also have a look at the following articles to learn more –
