Updated May 25, 2023
Population Variance Formula (Table of Contents)
Population Variance Formula
In statistics, a variance is a measure to find the dispersion of the data set values from the mean value of the data set. It measures the distance between that data point and the mean. So the higher the variance, the higher the dispersion, and data points tend to be far from the mean. Similarly, lower variance indicates that data points will be closer to the mean. It is beneficial in comparing data sets that may have the same mean value but a different range. Similarly, population variance indicates how the population data points are spread out. It is the average of the distances from each data point in the population to the mean squared.
Usually, calculate the variance of population data, but sometimes population data is so massive that it does not make economic sense to find the variance. In that case, sample variance is calculated, which will become the representative of the population variance.
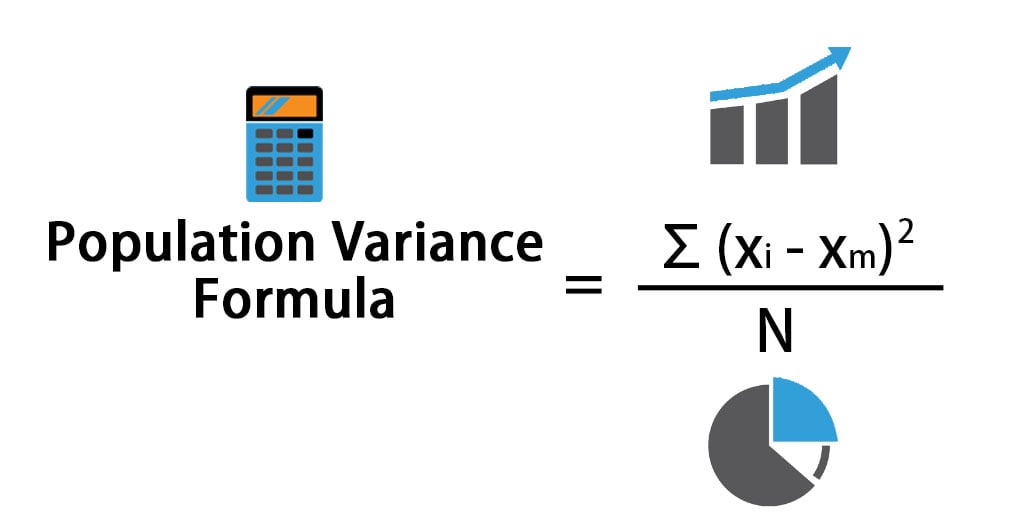
Suppose you have a population data set X with data points {X1, X2……..Xn}. The formula for Population Variance is given by:
Where:
- Xi – ith value of data set
- Xm – Mean value of data set
- N – Total number of data points
The formula may look confusing initially, but it is worth working on. Following are the steps which can be followed to calculate Population Variance:
- Find whether the data set you are working on is a sample or a population.
- Find the number of points in the data set, i.e., n for the population.
- The next step is to find the mean value. It is the average of all the values.
- After that, find the difference from the mean for each data point and square it.
- Take the sum of all values in the above step and divide that by the points calculated in point 2.
There is another way to calculate variance: using VAR.P() function for population variance and VAR.S () function for sample variance in Excel.
Examples of Population Variance Formula (With Excel Template)
Let’s take an example to understand the calculation of the Population Variance Formula in a better manner.
Population Variance Formula – Example #1
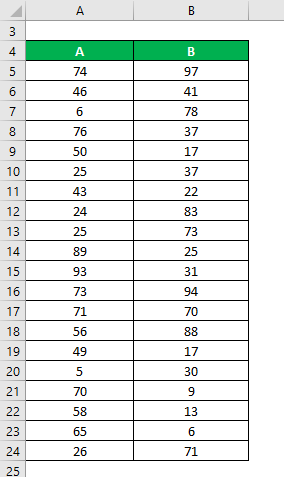
Let’s say we have two sample data sets, A & B, each containing 20 random data points. Calculate population variance for both data sets.
Data Set:
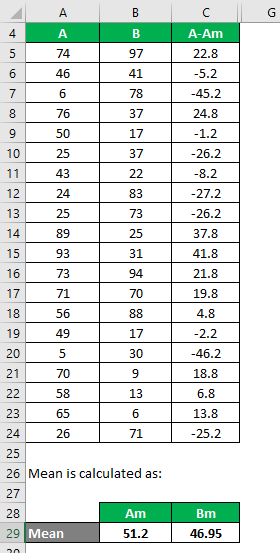
The mean is calculated as follows:
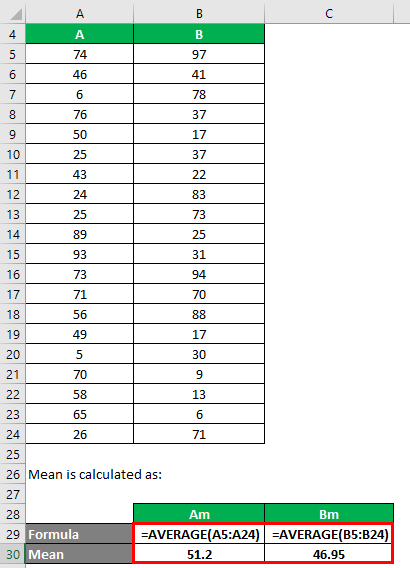
- Mean of Data Set A = 51.2
- Mean of Data Set B = 46.95
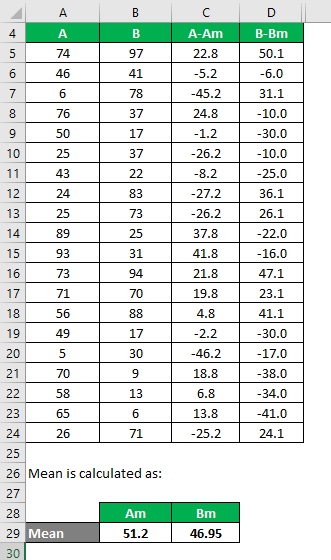
We must calculate the difference between the data points and the mean value.
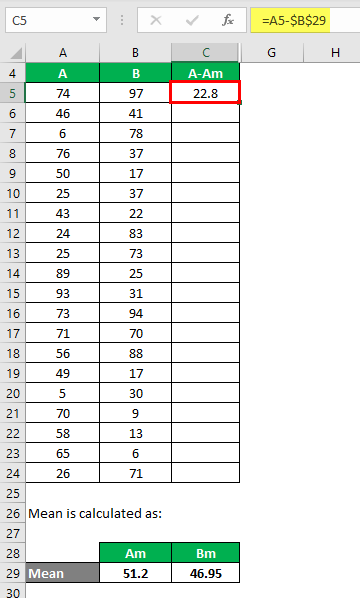
Similarly, calculate for all the data sets of A.
Similarly, calculate it for data set B also.
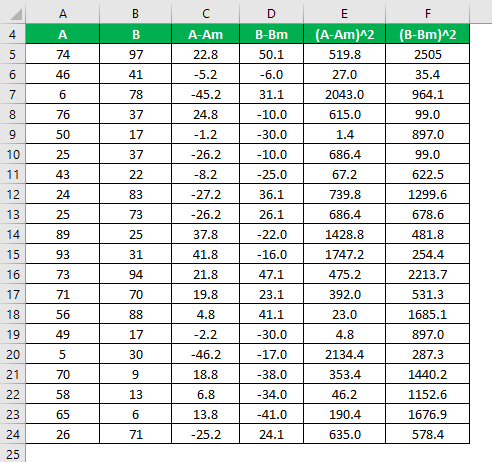
Calculate the square of the difference for both the data sets, A and B.
Population Variance is calculated using the formula given below
Population variance = Σ (Xi – Xm)2 / N
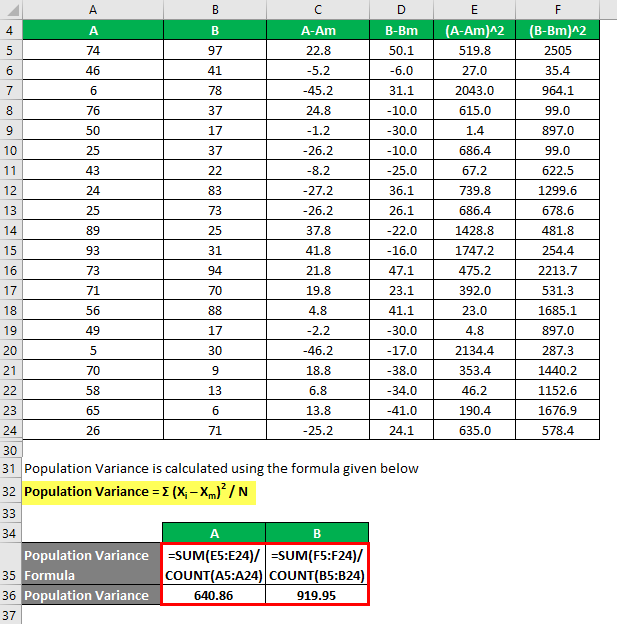
So if you see here, B has more variance than A, which means that the data points of B are more dispersed than A.
Population Variance Formula – Example #2
Let’s say you are a risk-averse investor looking to invest money in the stock market. Since your risk appetite is low, you want to invest in safe stocks with lower variance.
You want to analyze the stocks based on their past results, so we have decided to take a sample of 15 years and work on that data. Your financial advisor has suggested 4 stocks from which you can choose. You want to select 2 stocks among those 4, and you will decide that based on lower variance.
You have got information on their historical returns for the last 15 years.
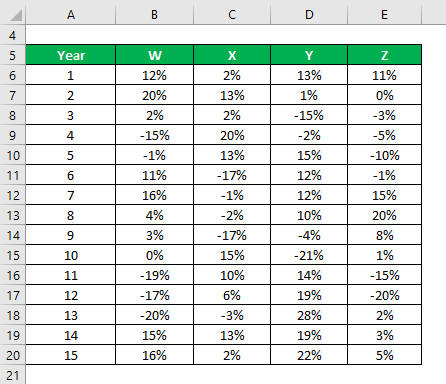
Population Variance is calculated using Excel Formula
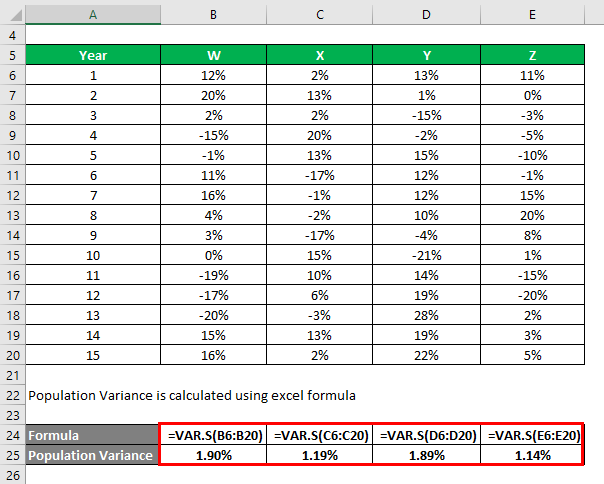
Based on the information, you will choose stocks X and Z to invest in since they have the lowest variance.
Explanation
We discuss the meaning of variance from a statistical standpoint, but it also helps us understand various financial ratios. We calculate standard deviation by taking the square root of the variance, laying the foundation for it. Standard deviation is a measure of the risk an investment carries and how risky that investment is. Based on an investment’s risk, investors can then calculate the minimum return they require to compensate for that risk. Variance value, since it is the square of a number, will always be positive. For a data set with all identical items, the value can be zero.
Relevance and Uses of Population Variance Formula
Variance helps the investors and analysts determine standard deviation, which allows find an investment’s risk and reward ratio or Sharpe ratio. Anyone can earn a risk-free rate of return by investing in Treasury and risk-free securities. But return over and above this is the excess return, and to achieve that.
To higher the Sharpe ratio, the better the investment.
We use variance to calculate the standard deviation, which measures risk. However, we don’t always prefer a lower standard deviation value. Suppose an investor has a higher risk appetite and wants to invest more aggressively. In that case, he will be willing to take more risks and prefer a higher standard deviation than a risk-averse investor. So it all depends on what level of risk an investor is ready to take.
Recommended Articles
This has been a guide to Population Variance Formula. Here we discuss calculating Population Variance, practical examples, and a downloadable Excel template. You may also look at the following articles to learn more –
