Discounted Cash Flow Meaning
Discounted Cash Flow (DCF) is a financial valuation method that determines the current value of an investment by checking its expected future earnings. In simple terms, discounted cash flow is a way to figure out how much future money is worth today by considering things like inflation and interest rates.
Table of Contents
Formula
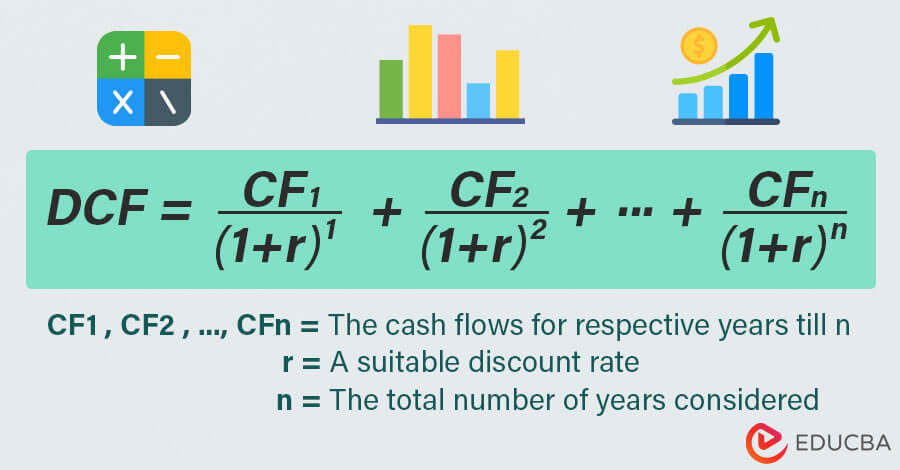
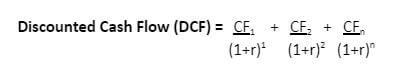
The primary Discounted Cash Flow (DCF) formula is:
Where,
- Cash Flows (CF1, CF2, CFn) =The cash flow for respective years till n
- Discount Rate (r) = A suitable discount rate based on risk and expected return.
- Number of Years (n) = The total years considered for holding the investments.
Analysis with Example
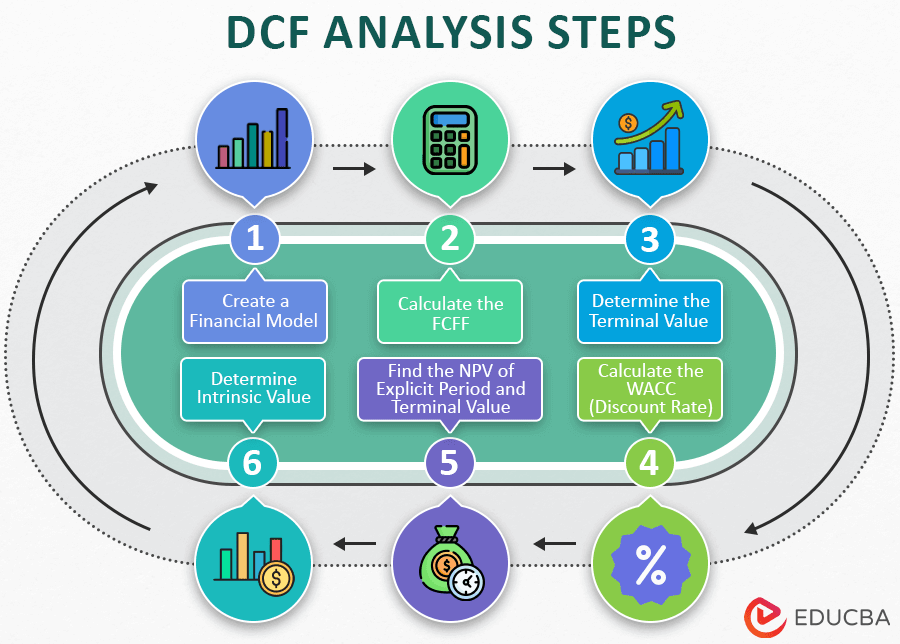
The discounted cash flow (DCF) analysis includes the following steps:
- Predict future earnings.
- Adjust them to today’s value using a discount rate.
- Compare the result to your initial cost.
- If it’s higher, it’s a good investment.
- If not, reconsider.
Example
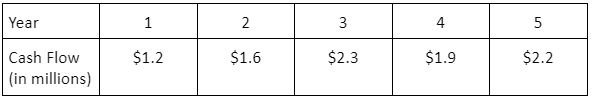
Imagine you want to invest in a new restaurant. The initial investment is $2 million. The business expects to have the following cash flows for the next 5 years:

Let us see how to calculate the discounted cash flow valuation for the restaurant after 5 years to see if it’s a good investment for you.
Solution:
Step 1: We already know the future cash flows, i.e., future earnings over the next 5 years.
Step 2: Let us choose a discount rate to calculate the present value. In this case, let’s use a 7% annual discount rate. Now, let’s calculate the present value for each year’s cost using the formula:
To perform the following calculations in Excel, use this formula:
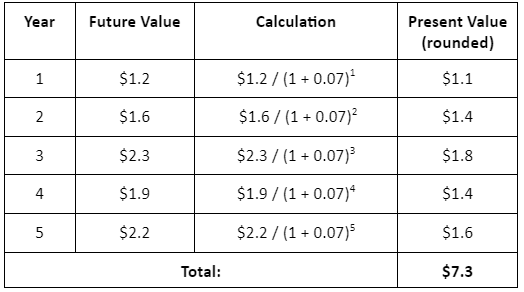
Thus, the discounted cash flow of your business is $7.3 million.
Step 3: After 5 years, your total earnings will be:
Total Earnings = DCF – Initial Investment
= $7.2 million – $2 million
= $5.2 million
How to Create a Discounted Cash Flow Model in Excel?
Now, after we have seen how to perform DCF analysis, let us walk you through creating a fully integrated Discounted cash flow model. We will create a model for Tesla to find its DCF valuation.
This is a part of our comprehensive Financial Modeling Course, where we have created the financial model of Tesla for five years (Forecasted years: 2023 to 2027).
Disclaimer: This DCF model for Tesla is only for educational purposes. eduCBA does not provide any recommendations.
Step 1: Create a 3-Statement Financial Model of Tesla
Our first essential step is creating Tesla’s 3-statement financial model. This involves constructing a projected income statement, balance sheet, and cash flow statement spanning at least 5 years. These projections set the groundwork for our valuation analysis.
Projected Income Statement:
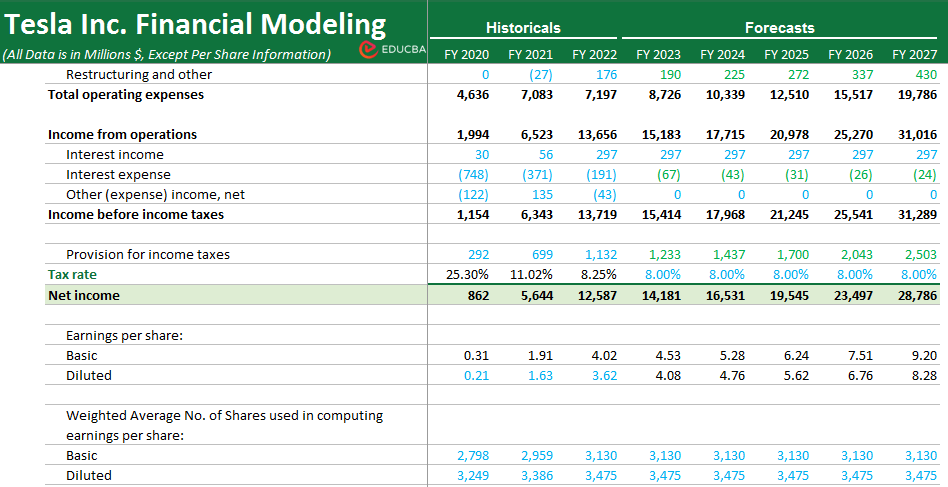
(Image Source: EDUCBA’s Financial Modeling & Valuation Course)
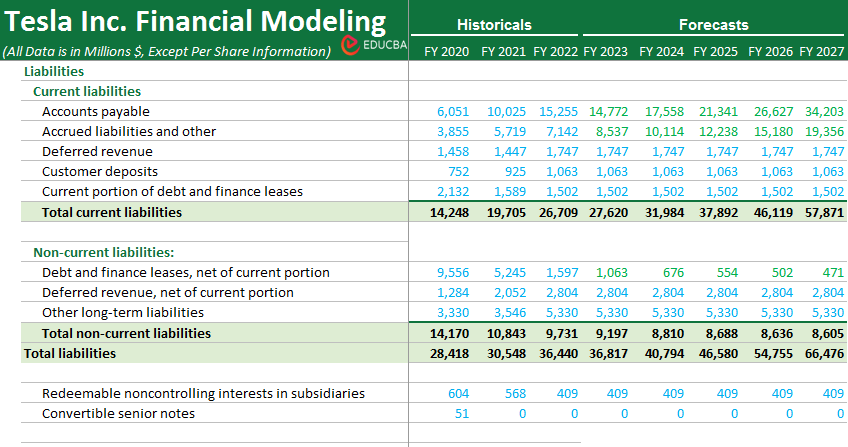
Projected Balance Sheet:
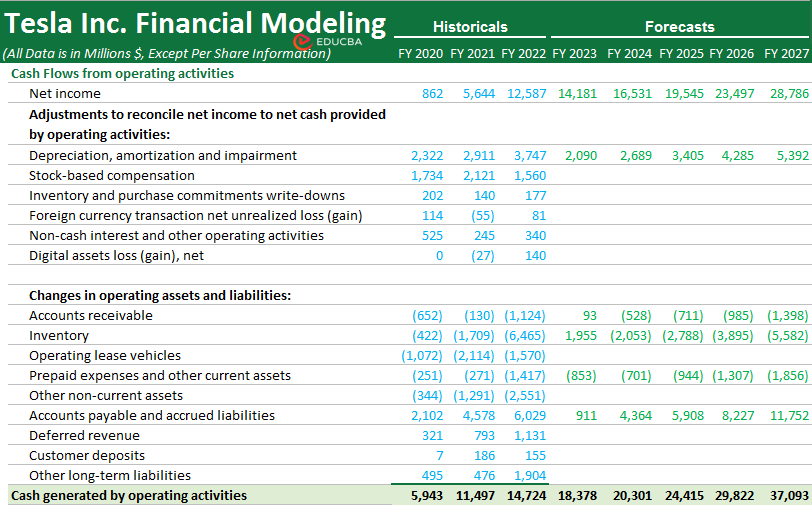
Projected Cash Flow Statement:
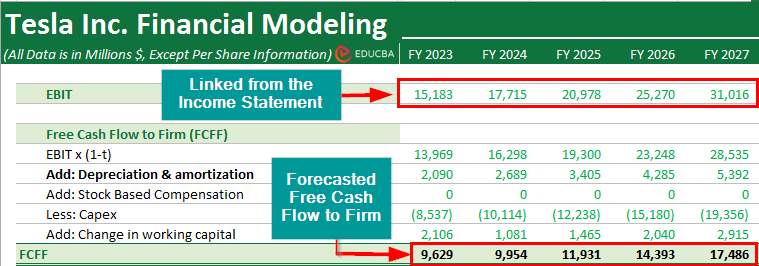
Step 2: Calculate the FCFF of Tesla
To find how much cash the business has to distribute to both equity and debt holders, we need to compute Tesla’s Free Cash Flow to the Firm (FCFF). The formula for it is,
To apply the above formula, we will need to follow these steps:
- Link the Operating Income (EBIT) from the Income Statement.
- Subtract Taxes and add Depreciation and amortization.
- Deduct Capital Expenditures (CapEx).
- Adjust for changes in Working Capital.
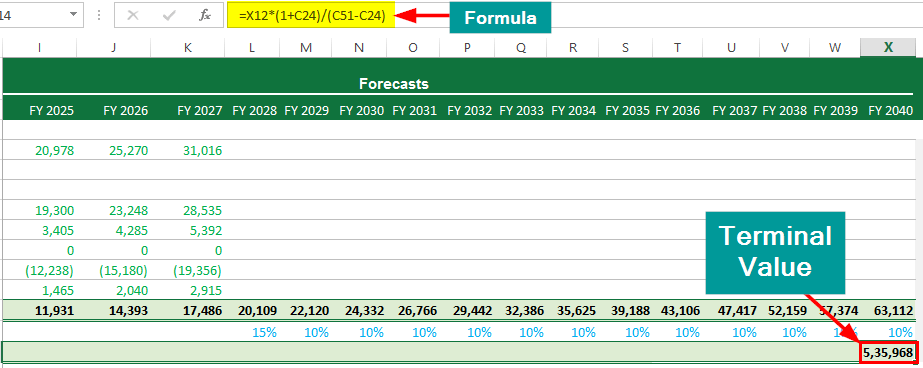
Step 3: Calculate the Terminal Value
Then, we must estimate the DCF Terminal Value. This step is essential because it will help you calculate the value of Tesla’s cash flows beyond the forecast period.
For this calculation:
- Calculate Final Year FCFF. (As our financial model spans only 5 years, we have assumed a year-over-year growth rate for the years following this period to determine their FCFF values).
- Consider the Terminal Growth Rate (We have considered it as 1%).
- Apply the perpetuity growth model:
Step 4: Calculate WACC (Discount Rate)
The whole purpose of DCF is to determine the value of future cash flows in the present time. We need a discount rate known as the Weighted Average Cost of Capital (WACC) to achieve this. Therefore, we must determine Tesla’s WACC to discount future cash flows appropriately. WACC represents the total cost of the company’s financing sources, i.e., debt and equity.
To determine WACC:
- Calculate Equity Proportion and Debt Proportion.
- Determine Cost of Equity and Cost of Debt.
- Apply the WACC formula:
Now, let’s see how to calculate each component of the WACC formula.
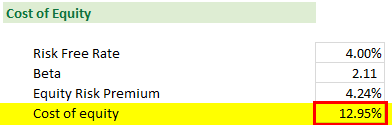
A) Cost of Equity Calculations
Understanding the cost of equity, a vital component of WACC, requires us to apply the Capital Asset Pricing Model (CAPM). This model helps identify the required return for equity investors.
To calculate the cost of equity:
- Determine the Risk-Free Rate.
- Identify Tesla’s Beta (β).
- Define the Equity Risk Premium.
- Apply the CAPM formula:
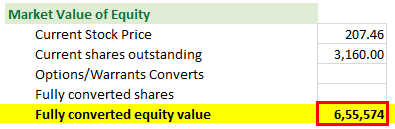
B) Equity Value Calculations
Finding the equity value is important as it is required for the proportion of equity calculation. We must also consider Tesla’s potentially dilutive securities for a comprehensive equity value.
- Calculate the value of Common Equity (Current Stock price * Current Shares Outstanding).
- Determine the value of Convertible Securities after Conversion.
- Sum these values as follows:
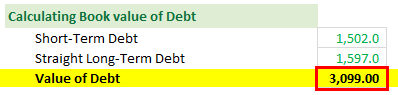
C) Value of Debt Calculations
Next, we must calculate the Book Value of Debt, which is Tesla’s total outstanding debt obligations.
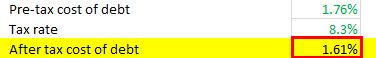
D) Cost of Debt Calculations
Here, we will find the “After-tax cost of debt” and not just the “Cost of debt.” To find the After-tax cost of debt, we must consider the interest rate while accounting for the tax rate. Here’s how to calculate:
- Determine the Interest Rate (from the Balance Sheet).
- Determine the Tax Rate (from the Income Statement).
- Compute the After-tax Cost of Debt:
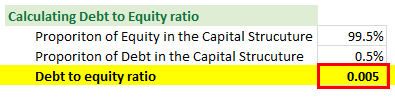
E) Proportion of Equity and Debt in the Capital Structure
Finally, we can analyze the proportion of Equity and Debt in Tesla’s capital structure.
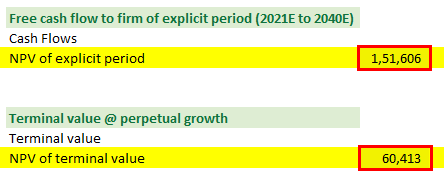
Step 5: Calculate NPV of Explicit Period and Terminal Value
In this core step, we will calculate Net Present Value (NPV) to determine the value of future cash flows in today’s terms. This concept factors in the time value of money concept.
- Compute the NPV of the explicit forecast period.
- Calculate the NPV of the terminal value.
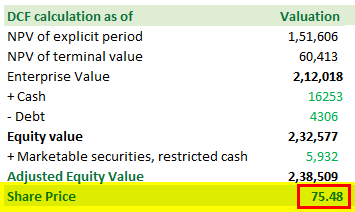
Step 6: Calculate Intrinsic Share Price
Ultimately, calculating the Intrinsic Share Price involves integrating NPV with adjustments for cash, debt, and marketable securities. Here’s how you can do it:
- Determine Enterprise Value (NPV of Explicit Period + NPV of Terminal Value)
- Determine Equity Value (Enterprise Value + Cash – Debt)
- Calculate Adjusted Equity Value (Equity Value + Marketable Securities, Restricted Cash).
- Calculate Intrinsic Share Price (Divide Adjusted Equity Value by Number of Shares Outstanding).
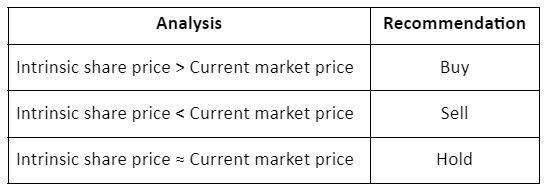
Final Analysis:
Methods of Discounted Cash Flow
While the general DCF principle remains the same, the two Discounted cash flow methods are:
1. Net Present Value (NPV): The NPV method determines the present value of a series of future cash flows at a particular discount rate. It lets us know how much an investment is worth in today’s terms.
2. Internal Rate of Return (IRR): The discount rate at which NPV becomes zero is the IRR. This annual rate lets us compare the initial investment with the future cash flow’s present value. If this rate is greater than your required rate of return, the investment is potentially attractive; otherwise, it may not be a good opportunity.
0 = ∑ {[(Future cash flow)n / (1+IRR)n] – Initial Investment}
Why is Discounted Cash Flow Important?
Discounted cash flow can help investors in the following aspects:
- Property/Company/Startup Valuation: It evaluates a company or income-generating property’s intrinsic value. It helps in understanding an asset’s present and future value.
- Comparison of Potential Investments: It provides a metric to compare diverse investment opportunities.
- Project/Investment Profitability: It shows whether an investment is going to be profitable. It provides a clear picture of a project’s long-term success rate.
- Understanding the Fair Value of an Investment: It determines if an investment is fairly priced by using expected cash flows.
- Decision Making for Projects: Using DCF, businesses can ascertain if a project’s returns justify its costs.
- Event-Driven Loss Calculation: It evaluates the financial impacts due to unexpected events. It’s helpful for insurers and stakeholders to analyze the losses after the disasters.
DCF vs. NPV
| Parameter | DCF | NPV |
| Full-Form | Discounted Cash Flow | Net Present Value |
| Definition | Calculates the present value of expected future cash flows of an investment or business. | It is a financial metric that helps determine if an investment is profitable. |
| Relationship | Tool for calculating NPV | Result of DCF analysis |
| Usage | Analyzes future performance of an investment | Compares the present value of cash flows for internal and external investments |
| Scope | Focuses on cash inflow, doesn’t directly factor in NPV | Needs DCF value for calculation |
Advantages and Disadvantages
| Advantages | Disadvantages |
| Discounted cash flow is a detailed and comprehensive valuation method. | DCF requires many assumptions, which increases errors. |
| Useful for valuing companies during mergers and acquisitions. | It can be difficult to estimate terminal value and WACC. |
| It helps calculate an investment’s Internal Rate of Return (IRR). | There can be challenges in forecasting and interest rate selection. |
Frequently Asked Questions (FAQs)
Q1. How to use WACC in a Discounted Cash Flow?
Answer: Here’s how to use WACC in DCF in concise steps:
- Calculate the cost of equity using the Capital Asset Pricing Model (CAPM) and the cost of debt (the interest rate on long-term debt after adjusting taxes).
- Compute WACC based on the company’s capital structure.
- Estimate future free cash flows (FCF) for a particular period.
- Use WACC as discount rates on FCFs and Terminal Value values to calculate net debt using WACC and divide by outstanding shares to get per-share value.
Q2. What are some constraints of the DCF method?
Answer: Below are some of the primary constraints of the DCF method:
- One of the primary challenges is estimating the Free Cash Flow (FCF) and the discount rate. As they change according to situations, it can lead to increased errors.
- It needs a significant amount of data, including estimated revenues and expenses, which may be hard to obtain accurately.
- Small changes in these assumptions about growth rates and the discount rate can lead to significant differences in valuation.
- It focuses primarily on long-term calculations, which may cause analysts to fail to observe short-term challenges and issues.
- Analysts may sometimes be overconfident about future cash flows, leading to inflated valuations.
Q3. Where can the Discounted Cash Flow Method be Used?
Answer: DCF is a technique to determine the present worth of expected future earnings. Real-life uses include:
- Buying a Business: For instance, when buying a café, it helps estimate its future earnings to decide the purchase price.
- Real Estate: Developers use it to predict future rental income from properties to see if the investment makes sense.
- Stock Market: Investors apply it to value company shares by analyzing potential future profits.
- Project Evaluation: Companies can use it to check if a new product launch might be profitable in the long run.
Recommended Articles
This is an all-inclusive article explaining what is discounted cash flow. It also includes a downloadable model. For more similar educational resources, check out the following articles,