Updated March 16, 2023

Introduction to Minitab Regression
Minitab regression is used to generate the regression analysis to describe the relationship of statistics between one or more predictors and the response variables. It will generally use the least-squares of the standard estimation method, deriving the equation of squared residuals. It generally defines the relationship between two variables which was continuous. The first variable contains the response, and another variable contains the predictor.
What is Minitab Regression?
- In Minitab regression, linear regression is known as bivariate linear regression. This type is used when we want to predict the value of the dependent variable, which was based on the independent variable value.
- The variable of dependent in Minitab regression is also considered or referred to as outcome, which was targeting the variable, which was the criterion.
- The independent variable is also considered an explanatory or predictor variable. But we can consider it as the dependent and independent variable.
- In Minitab, linear regression will contain the seven assumptions. However, we cannot test the first two assumptions using Minitab because they rotate in our variable choice and design of the study.
- We need to check this assumption before implementing the Minitab regression. If suppose this assumption does not meet the requirement, then we need to do the different statistical tests on the same.
- The assumption1 includes that our dependent variable will measure the level of continuous. Example of constant variable is temperature, height, salary, intelligence, firm size, sales, academic achievement, etc.
- The assumption2 includes that our dependent variable will measure the level of categorical and continuous. Suppose we have a categorical variable; it is widespread to use the independent test.
- In a Minitab linear expression predictor and response, two variables were related. When these two variables relate to each other, it is possible to predict the response value from the predictor is more accurate than the chance accuracy. This is because it provides the line that we fit the data more accurately. We can use this line to examine how the response will change as per the predictor variable.
- The Minitab multiple linear regression will examine the linear relationships between the predictors and continuous response.
- Suppose our regression predictors are more significant than before fitting the model of regression of all the predictors, we need to use the techniques of selection of the model. The Minitab regression also contains the ordinary least square regression, which was estimated and calculated using the equation, which minimizes the distance between sample data and point values of the predicted equation.
- Ordinary least square regression is more precise and will be an unbiased estimate when we meet the assumption of the linear regression module, which was coefficient. The ordinary least squares will module the curvature by transforming the variables.
How to Use Minitab Regression?
We must first download and install the same in our system to use the Minitab regression. Then, we require the Minitab statistical software application to use Minitab regression.
In the below example, we have already downloaded and installed the Minitab statistical software application in our system.
Below are steps showing how to use it:
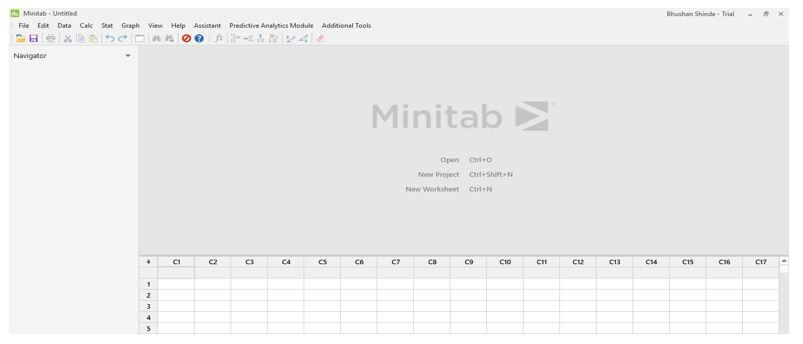
1. Check the Minitab statistical software application is installed in our system.
In the below example, we are checking the installation by opening the software.
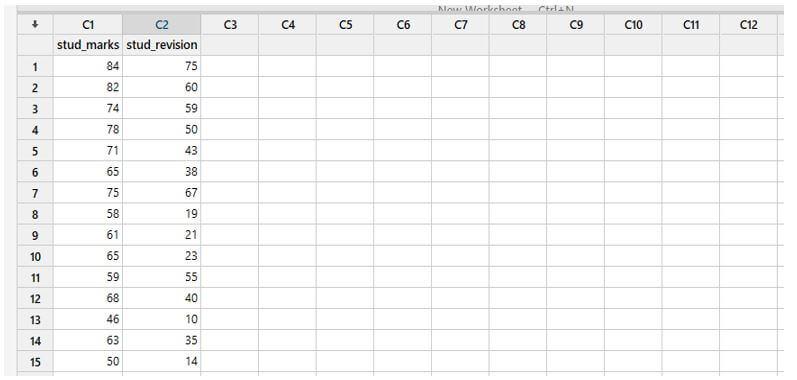
2. After checking the installation in this step, we enter our two variables in the C1 and C2 columns. Into the C1 column, we are entering the stud_marks. In the C2 column, we enter the independent variable name, i.e., stud_revision. In the example below, we enter the dependent variable score in the stud_marks column and the separate variable score in the stud_revision column.
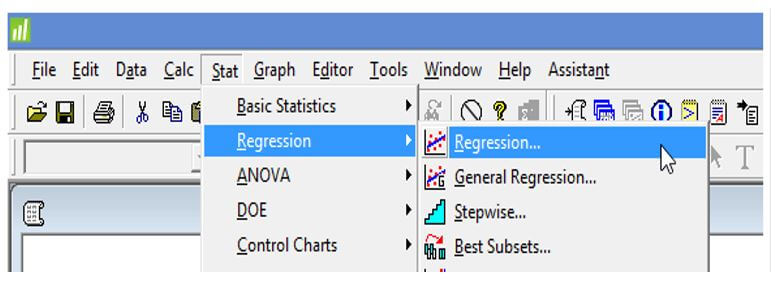
3. After entering data in this step, we check how to analyze the data using Minitab regression. We required three steps to run. To run the Minitab regression, first, we need to click on the stat table; after clicking on the stat tab, click on regression, then again click on regression.
The pictorial representation of this looks like as below:
Stat -> Regression -> Regression
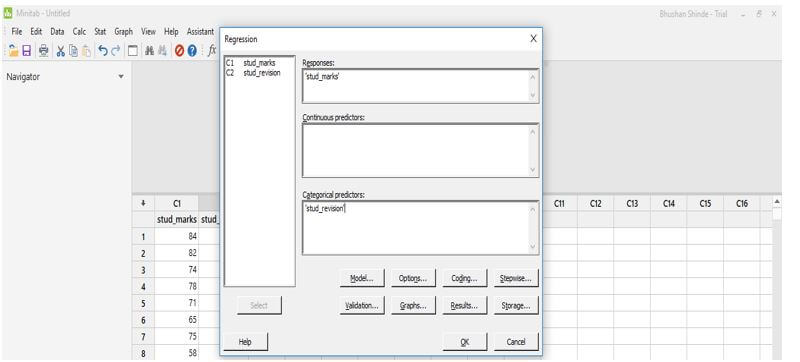
4. After clicking on regression following screen appears. Then click on stud_marks and add the same responses tab. After adding the response, we need to add the predictors, click on stud_revision and add the same in the categorical predictor’s tab.
5. After adding the regression and predictors, we need to click on the ok button to display the result of the Minitab regression. In the below example, we can see that the effect of Minitab regression is shown in the output tab.
Minitab Regression Analysis
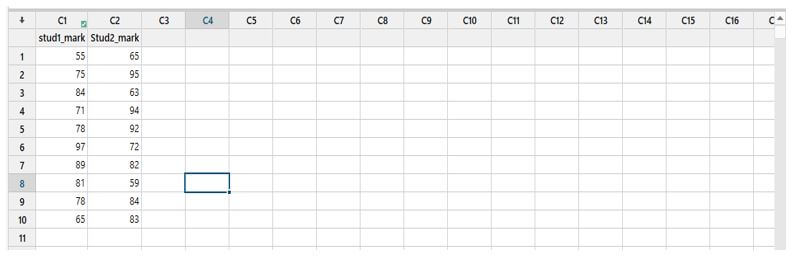
We can find the Minitab regression analysis of sample data provided to the Minitab regression analysis. Therefore, we are providing the below data for the analysis.
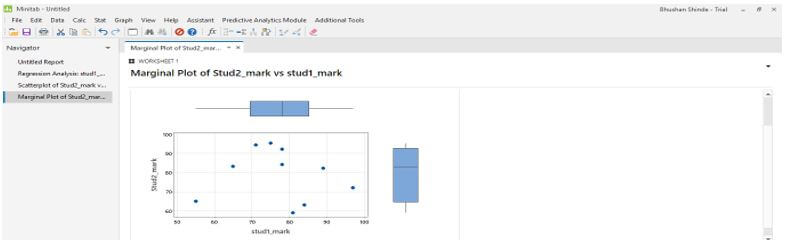
We are entering our two variables in C1 and C2 columns. Into the C1 column, we are entering the stud1_mark. In the C2 column, we enter the independent variable name, i.e., stud2_mark. In the example below, we enter the dependent variable score in the stud1_mark column and the independent variable score in the stud2_mark column.
While using the above data, we are finding the analysis if it is as follows.
The analysis contains the following parameters as follows:
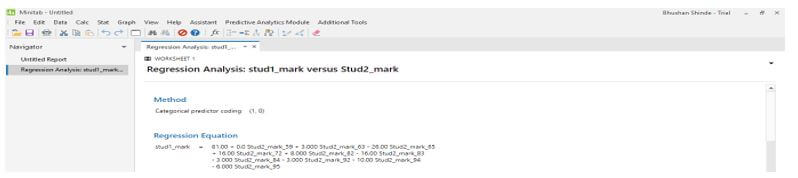
- Method
- Regression equation
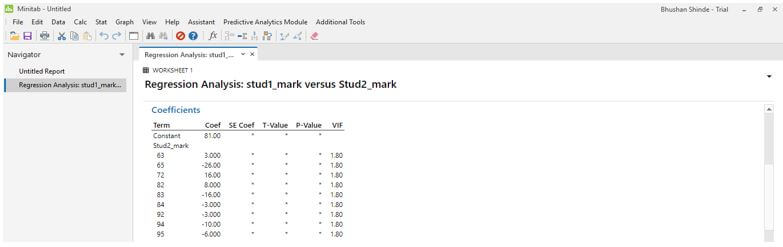
- Coefficients
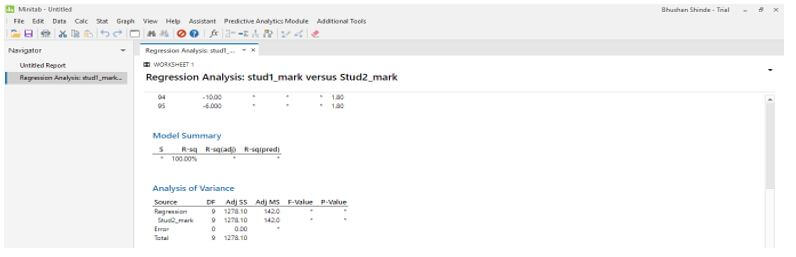
- Model summary
- Analysis of variance
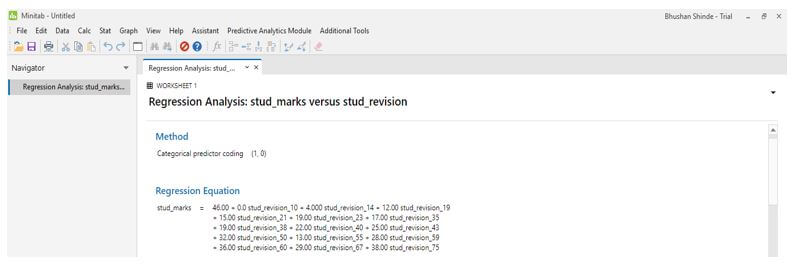
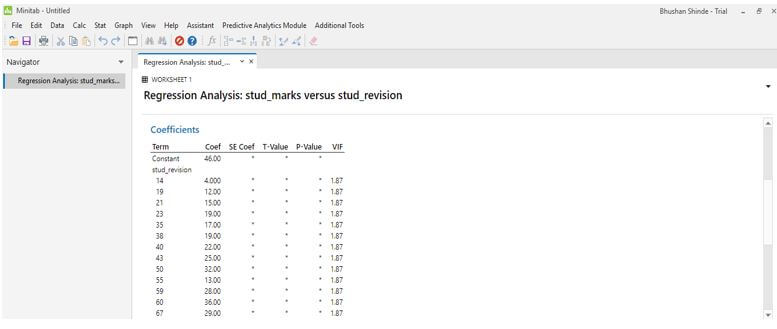
The method parameter will consist of the categorical predictor coding in zero and one format. The regression equation consists of the mark of every student. The coefficient will show different types of values in the output. Finally, the model and analysis of variance will consist of a summary of the analysis.
In the below image, we are retrieving the analysis in text format.
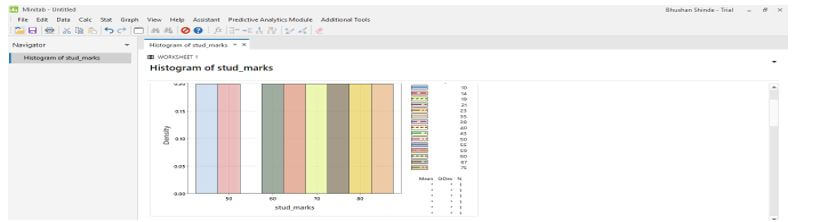
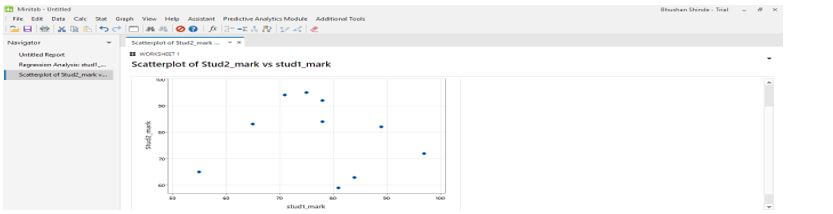
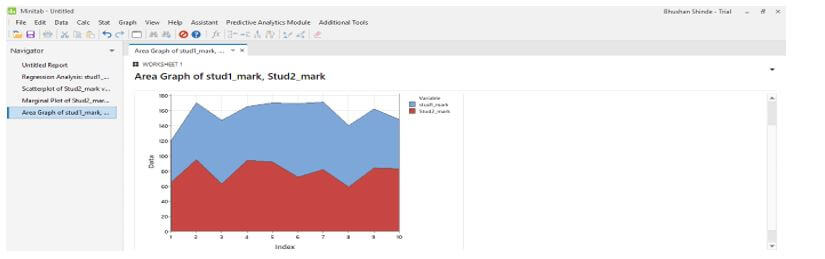
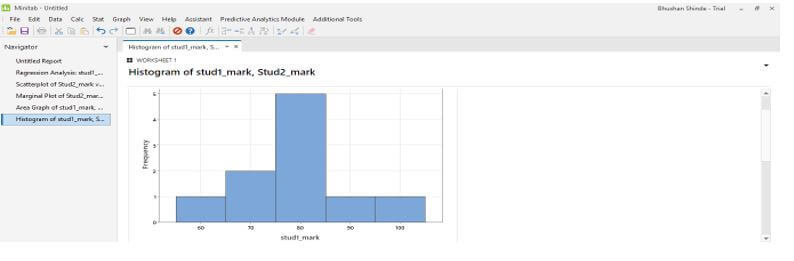
In the below example, we provide the analysis in graphical format as follows.
Conclusion
The variable of dependent in Minitab regression is also considered or referred to as outcome, which was targeting the variable, which was the criterion. It is used to generate the regression analysis to describe the statistical relationship between one or more predictors and the response variables.
Recommended Articles
This is a guide to Minitab Regression. Here we discuss the introduction and how to use Minitab regression with analysis. You may also have a look at the following articles to learn more –
