Introduction to Data Analysis Tools
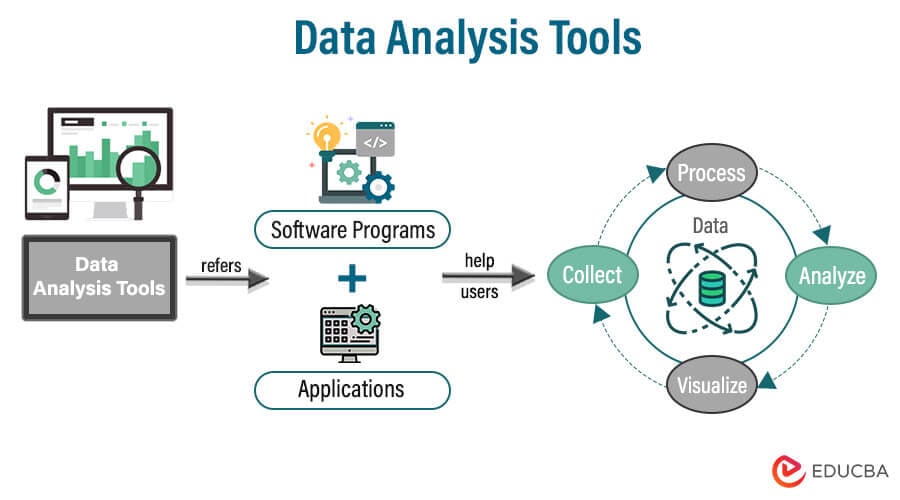
Data analysis tools refer to software programs and applications that help users collect, process, analyze, and visualize data.
According to a recent survey, 46% of organizations reported using big data analytics to gain insights into their business operations. The global market for big data analytics tools has a valuation of $240.56 billion.
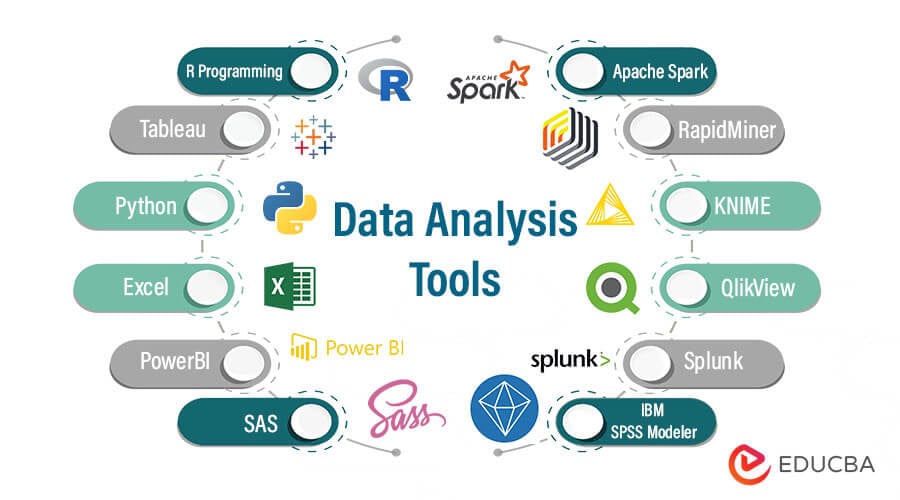
Data analysis tools are widely used across industries, from finance and healthcare to marketing and retail. They can help businesses identify patterns, trends, and anomalies in their data, make data-driven decisions and improve their overall performance and profitability. This article explores some of the top data analysis tools that data analysts can use to gain insights and add value to their organizations.
Key Highlights
- Data analysis tools are crucial to any business as they help make business processes more efficient.
- Power BI is a top data analysis tool that allows users to connect, analyze, and visualize data from various sources.
- SQL is another popular tool for data analysis, as it allows for efficient querying and manipulation of large datasets.
- Python is a versatile programming language that can be used for data analysis, machine learning, and more.
- Excel remains a powerful tool for data analysis, offering a familiar interface and a wide range of functions and features.
 1. R Programming
 1. R Programming
R is the industry’s leading analytical tool, commonly used in data modeling and statistics.
- It is a free language and software for statistical computing and graphics programming.
- R allows manipulation and information presented in a variety of ways.
- R compiles and operates on many platforms, including macOS, Windows, and Linux.
- It has the option to navigate packages by category 11,556 packages.
- R also offers instruments to install all the packages automatically, which can be well-assembled with large amounts of information according to the user’s needs.
2. Tableau
 2. Tableau
Tableau is a powerful data analytics and visualization tool to explore and analyze data from various sources.
- It offers drag-and-drop functionality to create interactive dashboards and reports, making it easy for non-technical users to work with data.
- Tableau supports many data sources and file formats, including spreadsheets, databases, cloud-based data, and big data platforms.
- It provides a range of advanced analytics features such as predictive modeling, forecasting, and statistical analysis to gain insights into data.
- Tableau also supports collaboration and sharing of data and reports among teams, making it an ideal tool for enterprise-level data analysis.
3. Python
 3. Python
Python is an object-oriented, user-friendly, open-source language developed by Guido van Rossum in the early 1980s.
- It is a popular language for data analytics due to its simplicity, versatility, and extensive libraries such as NumPy, Pandas, and Scikit-learn.
- It offers various data visualization tools like Matplotlib and Seaborn, which helps to create interactive charts and graphs to analyze data better.
- With Python’s capabilities in machine learning, it is widely used in predictive analytics, natural language processing, and image processing.
- It is an open-source language with a vast community offering support, documentation, and tutorials, making learning and implementing data analytics easy.
4. Excel
 4. Excel
Excel is a Microsoft software program part of the software productivity suite Microsoft Office.
- It is a core and standard analytical tool used in almost every industry.
- Excel is essential when analytics on the inner information of the customer is required.
- It analyzes the complicated job of summarizing the information using a preview of pivot tables to filter it according to customer requirements.
- Excel has the advanced option of business analytics to assist with modeling pre-created options such as automatic relationship detection, DAX measures, and time grouping.
- Typically, uses of Excel involve calculating cells, pivoting tables, and graphing multiple instruments.
- For example, one can create a monthly budget for Excel, track business expenses, or sort and organize large amounts of data with an Excel table.
5. PowerBI
- Power BI is a powerful and user-friendly business intelligence tool that allows you to create interactive data visualizations and reports quickly and easily.
- It can connect to various data sources, including Excel spreadsheets, databases, and cloud-based services like Azure and Salesforce.
- With Power BI, you can create custom dashboards, charts, and graphs that make it easy to visualize and understand complex data sets.
- Power BI includes advanced analytics features like forecasting, clustering, and trend analysis, which can help you gain deeper insights into your data.
- It also allows you to share your reports and dashboards with others, collaborate in real time, and access your data from anywhere using the cloud-based Power BI service.
6. SAS
SAS stands for Statistical Analysis System and is a programming environment and language for data management and analysis.
- The SAS Institute developed SAS in 1966 and developed it in the 1980s and 1990s.
- SAS is easy to manage, and information from all sources can be analyzed.
- In 2011, SAS launched a wide range of customer intelligence goods and many SAS modules, commonly applied to client profiling and future opportunities for web, social media, and marketing analytics.
- It can also predict, manage, and optimize their behavior.
- SAS uses memory and distributed processing to analyze enormous databases quickly.
- Moreover, SAS helps to model predictive information.
7. Apache Spark
 7. Apache Spark
Created in 2009 by the University of California, AMP Lab of Berkeley.
- Apache Spark is a quick-scale data processing engine and runs apps 100 times quicker in memory and ten times faster on disk in Hadoop clusters.
- Spark is based on data science, and its idea facilitates data science.
- Apache Spark is also famous for developing information pipelines and machine models.
- Spark also has a library – MLlib, that supplies several machine tools for recurring methods in information science, such as regression, grading, clustering, collaborative filtration, etc.
- Apache Software Foundation launched Spark to speed up the Hadoop software computing process.
8. RapidMiner
 8. RapidMiner
RapidMiner is an open-source data analytics tool for data preparation, machine learning, and predictive modeling.
- It offers an intuitive graphical user interface, supports over 40 machine learning algorithms, and provides various data visualization options.
- RapidMiner supports various data types, including structured, semi-structured, and unstructured data, making it a versatile tool for multiple data analytics projects.
- The platform offers a drag-and-drop interface that enables users to quickly design and execute data processing, modeling, and visualization workflows without requiring extensive programming knowledge.
- RapidMiner also provides a community-driven marketplace where users can access hundreds of pre-built machine learning algorithms, data connectors, and extensions and share their custom-built components with others in the community.
9. KNIME
 9. KNIME
A team of software engineers from Constance University developed KNIME in January 2004.
- It is an open-Source workflow platform for information processing, building, and execution.
- KNIME utilizes nodes to build graphs that map information flow from input to output.
- With its modular pipeline idea, KNIME is a powerful leading open-source reporting and built-in analytical tool to evaluate and model the information through visual programming, integrating different data mining elements and machine learning.
- Every node carries out a single workflow job.
10. QlikView
 10. QlikView
QlikView has many distinctive characteristics, such as patented technology and memory processing, which can quickly execute the outcome for end customers and store the information in the document itself.
- Data association is automatically retained in QlikView, and almost 10% of the initial volume can be compressed.
- Color visualization of the information connection– a particular color for associated and non-related information.
- As an auto-service BI tool, QlikView is usually easy to collect without having unique data analysis or programming abilities for most company customers.
- It is often used in marketing, staffing, and sales departments, as well as in management dashboards to monitor general company transactions at the highest management level.
- Most organizations train company users before providing software access, while no unique abilities are needed.
11. Splunk
 11. Splunk
Launched in 2004, Splunk gradually became viral among businesses and began to purchase their company licenses.
- Splunk is a software technology used to monitor, search, analyze, and view information produced by the computer in real-time.
- It can track and read various log files and save information on indexers as occurrences.
- Splunk can display information on different types of dashboards with these tools.
12. IBM SPSS Modeler
 12. IBM SPSS Modeler
IBM SPSS Modeler is a powerful data mining and predictive analytics software that helps businesses and organizations identify patterns and relationships within their data to gain insights and make informed decisions.
- The tool provides a range of advanced statistical and analytical techniques, such as clustering, decision trees, and neural networks, to help users uncover hidden patterns and trends in their data.
- With a user-friendly interface and drag-and-drop functionality, IBM SPSS Modeler allows users to quickly and easily build and deploy predictive models without a deep understanding of programming or data science.
- It contains a variety of sophisticated analytical and algorithms.
- It is most potent when used to uncover strong patterns in continuing business processes and then capitalize by deploying business models to predict choices better and achieve optimum results.
Final Thoughts
Many different data analytics solutions on the market can meet the demands and requirements of different types of enterprises. Selecting the tool that aligns with an organization’s aims and objectives is crucial because each tool has unique features and advantages. While Excel and SQL are well-liked programs for data analysis, other programs like Tableau, IBM SPSS Modeler, and Power BI provide more sophisticated features and capabilities for modeling and visualizing data. In the end, investing in the proper data analytics technology will assist firms in gaining insightful knowledge from their data and making wise decisions that will promote growth and success.
Frequently Asked Questions (FAQs)
1. What tool is best for data analysis?
Answer: There are various tools for data analysis, but the best one depends on the type of data and the analysis required. Some popular tools include
- Excel
- Tableau
- R
- Python
- SAS
2. Is SQL a data analysis tool?
Answer: SQL is primarily a database management language, but it can be used for data analysis purposes such as
- Filtering
- Sorting
- Grouping
- Aggregating data.
3. What are the 5 data analytics types?
Answer: The five types of data analytics are-
- Descriptive analytics – summarizes past data to inform what happened
- Diagnostic analytics – identifies the reasons why something happened in the past
- Predictive analytics – forecasts future outcomes based on historical data
- Prescriptive analytics – suggests the best course of action based on predictive models
- Cognitive analytics – uses artificial intelligence and machine learning to identify patterns and make recommendations.
4. Is Excel a data analysis tool?
Answer: Yes, Excel is a popular data analysis tool that is commonly used for tasks such as-
- Data cleaning
- Sorting
- Filtering
- Creating charts and graphs
Recommend Articles
We hope that this EDUCBA information on “Data Analysis Tools” was beneficial to you. You can view EDUCBA’s recommended articles for more information.:-

