Updated June 9, 2023
Difference Between Data Visualisation vs Data Analytics
Data visualization is nothing but representing data in a visual form. This visual form can be a chart, graph, list, map, etc. This representation helps people to understand the magnitude of the data. Data analytics examines data sets (structured or unstructured) to get valuable insights to conclude the datasets. Data analytics techniques and technologies are widely used in many organizations.
Head-to-Head Comparisons Between Data Visualisation vs Data Analytics (Infographics)
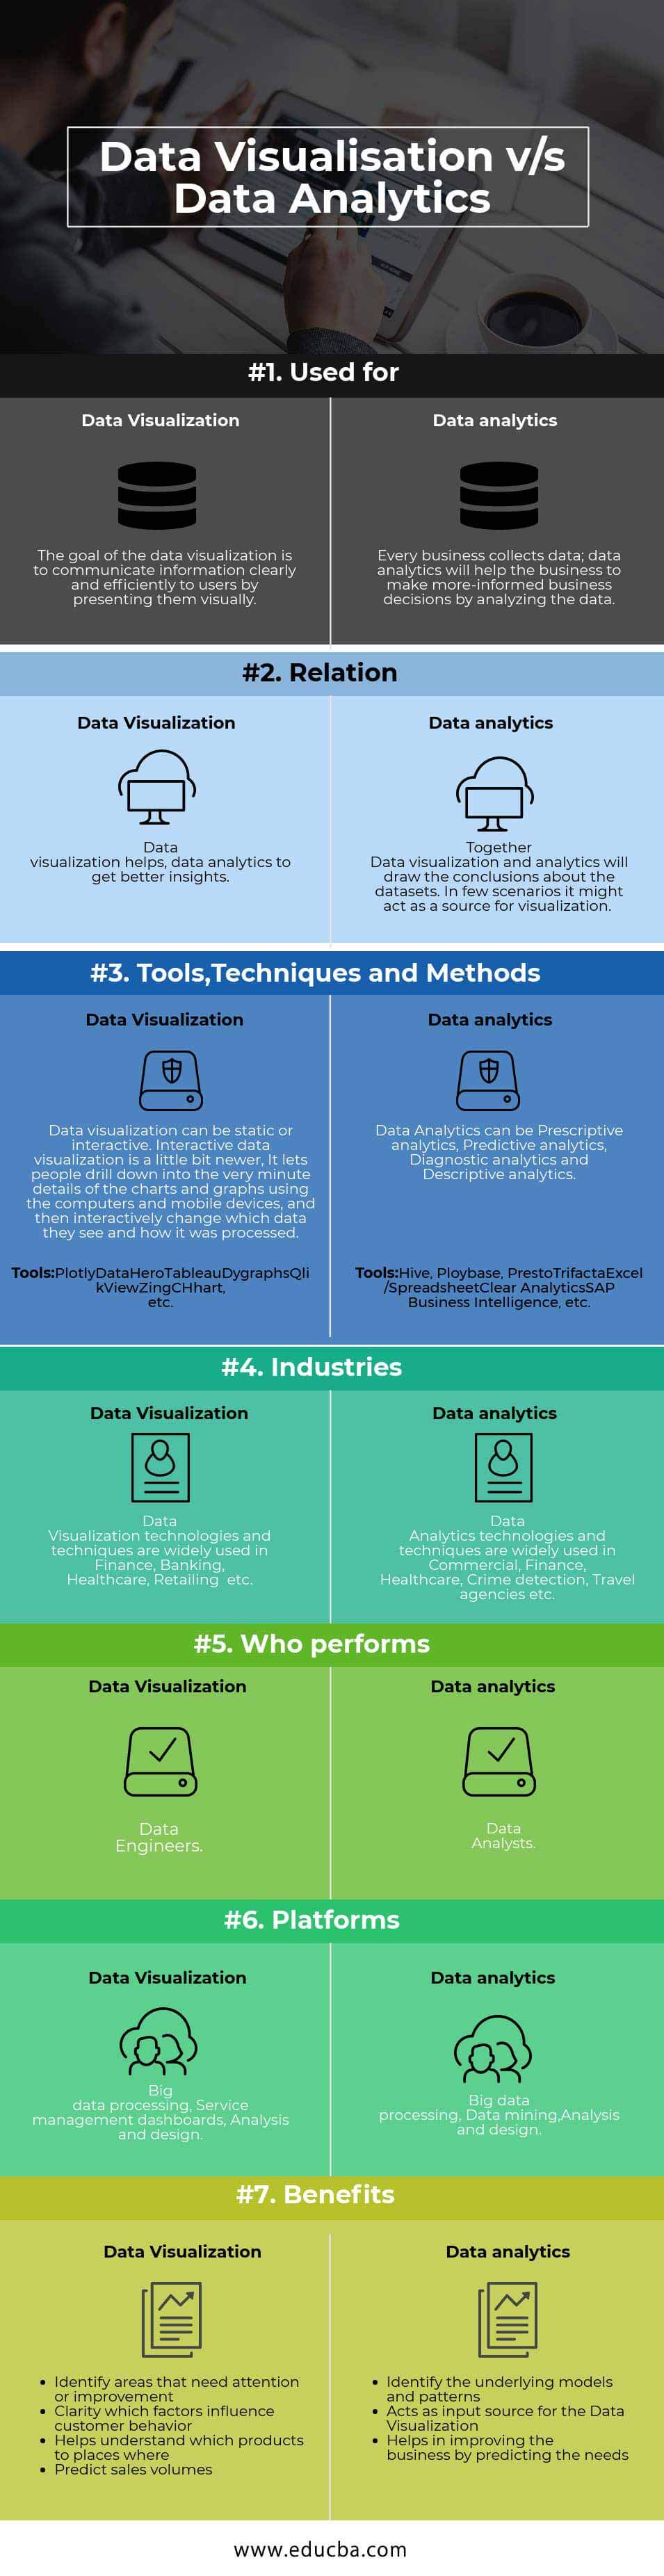
Below is the Top 7 difference between Data Visualisation vs Data Analytics:
Key Difference Between Data Visualisation vs Data Analytics
Below are the lists of points that describe the key differences between Data Visualization vs Data Analytics:
- Data visualization is the presentation of data in a visual or graphical format. Data analytics also makes it easier to recognize patterns and derive meaning from complex data sets.
- Data visualization enables decision-makers to see analytics presented visually so they grasp difficult concepts or identify new patterns.
- Looking at a visualization of an attribute in-depth will lead to the analytics of that attribute.
- The analytics process, including the deployment and use of big data analytics tools, can help companies improve operational efficiency, drive revenue and gain competitive advantages over business rivals.
- Descriptive analytics describes something that has already happened and suggests its root causes.
- Prescriptive analytics help companies anticipate business opportunities and make decisions that affect profits in areas such as targeted marketing campaigns.
- Predictive analytics help historical data sets for patterns indicative of future situations and behaviors
- In visualizations, we have static and interactive visualizations.
- Static visualizations focus on a specific data store; User’s can’t go beyond a single view to explore other stories beyond what’s in front of them. The story is captured explicitly in an engaging single-page layout.
- Interactive visualizations help users to select specific data points to build a visualized story of their choosing.
- Data Analytic insight takes discovery to the next level by allowing practitioners to explore their data and understand the underlying factors and impacts beyond simply asking WHY.
- Using charts, graphs, and design elements, data visualization can help businesses explain trends and stats more easily. Data visualization also exposes patterns, trends, and correlations that may otherwise go undetected.
- Data analysts translate numbers into plain text (English), whether it’s sales figures, market research, logistics, or transportation costs.
- Computers made it possible to process large amounts of data at lightning-fast speeds. Today, data visualization has become a rapidly evolving blend of science and art that is certain to change the corporate landscape over the next few years.
- Data analytics is a trending practice that many companies are adopting. Before jumping in and buying data analytics tools, organizations should first get to know the landscape.
- Let’s take an example to understand Data Visualization very clearly.
For example, let’s take Thanksgiving Day as a use case in our scenario, as we all know that the sales on Thanksgiving Day will be very high, and purchasing will be at its peak.
To help the business owner understand the purchase history of the items, a pie chart or a graph will help them know better than looking at the numbers in the purchase history. So that business owners can plan their business according to the trend. - Let’s take an example of Data Analytics to understand the power of analytics.
We all do Online shopping and must have seen this message in our mailbox -“We Missed You” message from our favorite e-commerce website if we don’t shop for a while. The scene behind this message includes a ‘detailed examination’ of our orders and orders history. The analytics tools give the business the intelligence to attract customers and increase revenue.
Data Visualization vs Data Analytics Comparision Table
Following is the comparison table between Data Visualization vs Data Analytics.
| Data Visualization | Data Analytics | |
|
Used for |
Data visualization aims to communicate information clearly and efficiently to users by presenting it visually. | Every business collects data; data analytics will help the company make more informed decisions by analyzing the data. |
| Relation | Data visualization helps data analytics to get better insights. | Together Data visualization and analytics will conclude the datasets. In a few scenarios, it might act as a source for visualization. |
|
Tools, Techniques, and Methods |
Data visualization can be static or interactive. Interactive data visualization is a bit newer; it lets people drill down into the very minute details of the charts and graphs using computers and mobile devices and then interactively change which data they see and how it is processed.
Tools:
|
Data Analytics can be Prescriptive analytics, Predictive analytics, Diagnostic analytics, and Descriptive analytics.
Tools:
|
| Industries | Data Visualization technologies and techniques are widely used in Finance, Banking, Healthcare, Retailing, etc. | Data Analytics technologies and techniques are widely used in Commercial, Finance, Healthcare, Crime detection, Travel agencies, etc. |
| Who performs | Data Engineers. | Data Analysts. |
|
Platforms |
Big data processing, Service management dashboards, Analysis, and design. | Big data processing, Data mining, Analysis, and design. |
|
Benefits |
|
|
Conclusion
The difference between Data Visualisation and Data Analytics is noticeable regarding enterprise needs. It also clears that, though important, visualizations cannot be the sole component of the solution for data processing; data visualization and Data analytics together will draw good conclusions for the business. Choosing visualization tools and analytics tools varies from organization to organization, according to the type of data it handles and how big the organization is.
Recommended Articles
This has been a guide to Data Visualization vs Data Analytics. Here we have discussed Data Visualization vs Data Analytics head-to-head comparisons, key differences, and a comparison table. You may also look at the following article to learn more –
