EDUCBA

EDUCBA

MENUMENU
  • Free Tutorials
  • Free Courses
  • Certification Courses
  • 360+ Courses All in One Bundle
  • Login
Home Data Science Data Science Tutorials R Programming Tutorial Bar Charts in R
Secondary Sidebar
R programming Tutorial
  • Chart/graphs
    • Graphs in R
    • Bar Charts in R
    • Pie Chart in R
    • Histogram in R
    • Line Graph in R
    • Plot Function in R
    • Scatterplot in R
    • R Boxplot labels
  • Basic
    • What is R Programming Language
    • Careers in R Programming
    • Install R
    • List of R Packages
    • Introduction of R Tools Technology
    • R Programming Language
    • DataSet in R
    • What is RStudio?
    • R-studio-Functions
    • R Packages
    • Time series?in R
    • R Data Types
    • R for data science
    • R Operators
    • R Data Frame
    • R Analytics Tool
    • R Tree Package
    • Vectors in R
  • Control statement
    • If Statement in R
    • If Else Statement in R
    • Else if in R
    • Switch Statement in R
  • Loops
    • Loops in R
    • For Loop in R
    • Nested For Loop in R
    • While Loop in R
    • Next in R
  • Regression in R
    • Simple Linear Regression in R
    • Linear Regression in R
    • Multiple Linear Regression in R
    • Logistic Regression in R
    • Poisson Regression in R
    • OLS Regression in R
    • P-Value in Regression
  • Anova in R
    • ANOVA in R
    • One Way ANOVA in R
    • Two Way ANOVA in R
  • Data Structure
    • R list
    • Arrays in R
    • Data Frames in R
    • Factors in R
    • R Vectors
  • Advanced
    • Statistical Analysis with R
    • R String Functions
    • Data Exploration in R
    • R CSV Files
    • KNN Algorithm in R
    • Sorting in R
    • lm Function in R
    • Hierarchical Clustering in R
    • R Normal Distribution
    • Binomial Distribution in R
    • Decision Tree in R
    • GLM in R
    • Arima Model in R
    • Linear Model in R
    • Predict Function in R
    • Survival Analysis in R
    • Standard Deviation in R
    • Statistical Analysis in R
    • Predictive Analysis?in R
    • T-test in R
    • Database in R
  • Programs
    • Functions in R
    • Boxplot in R
    • R Program Functions
    • Factorial in R
    • Random Number Generator in R
  • Interview question
    • R Interview Questions

Related Courses

R Programming Certification Course

Statistical Analysis Course Training

All in One Data Science Courses

Bar Charts in R

By Priya PedamkarPriya Pedamkar

Bar Charts in R

Introduction Bar Charts in R

Bar Charts in R are the commonly used chart to create a graphical representation of the dataset. The Bar chart is represented as vertical or horizontal bars where the bar length or height indicates the count or frequency or any other calculated measure of the variable. As a best practice, a vector or a matrix can be used as input to the bar chat creation function in R for plotting bar charts. In addition, there are various labels, and color assignment features are available with the bar plot function, which is used to create the bar charts.

Syntax

Start Your Free Data Science Course

Hadoop, Data Science, Statistics & others

The Basic syntax to create a Bar chart in R is shown below.

All in One Data Science Bundle(360+ Courses, 50+ projects)
Python TutorialMachine LearningAWSArtificial Intelligence
TableauR ProgrammingPowerBIDeep Learning
Price
View Courses
360+ Online Courses | 50+ projects | 1500+ Hours | Verifiable Certificates | Lifetime Access
4.7 (86,700 ratings)

barplot (H, xlab, ylab, main, names.arg, col)

Description of the Parameters are:

H denotes height (vector or matrix). If H is a vector, the values determine the heights of the bars. If it is a matrix with option false corresponds to sub bars, and true denotes to create a horizontal bar.

  • xlab: Label for X-axis
  • ylab: Label for Y-axis
  • main: Heading of the bar chart
  • names. arg: Label to the bars a character vector.
  • col: It gives color to the bars in the chart.

How to create a simple Bar Chart in R?

Here we shall discuss how to create Bar charts using function barplot () in R, which is very easy to implement with vertical and horizontal bars. In the below example, we will see creating charts using vectors.

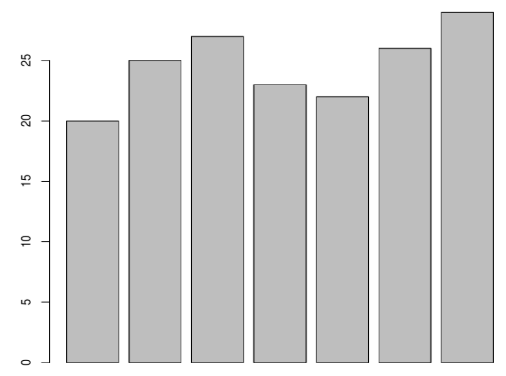
temp <- c(20, 25, 27, 23, 22, 26, 29)
barplot(temp)

Output:

The bar Plot should look like this:

Bar Chart

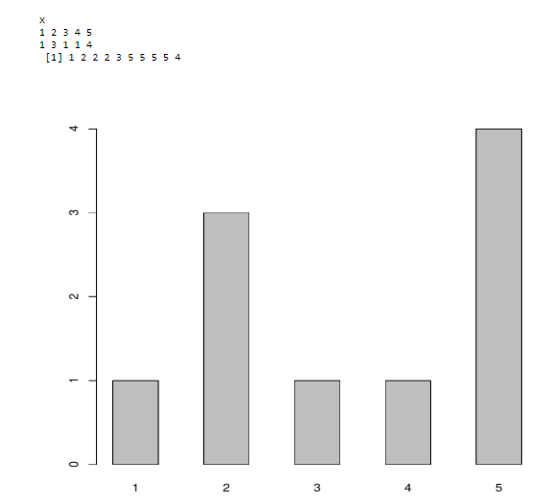
The next example comes with initializing some vector of numbers and creating a table () command to count them. The width of the bar can be adjusted using a parameter width () and space by space () in the barplot.

// Vector numbers are created using function c ()
x<- c (1,2,2,2,3,5,5,5,5,4)
cnt <- table(x)
cnt
x
barplot (cnt , space =1.0)

vector of number

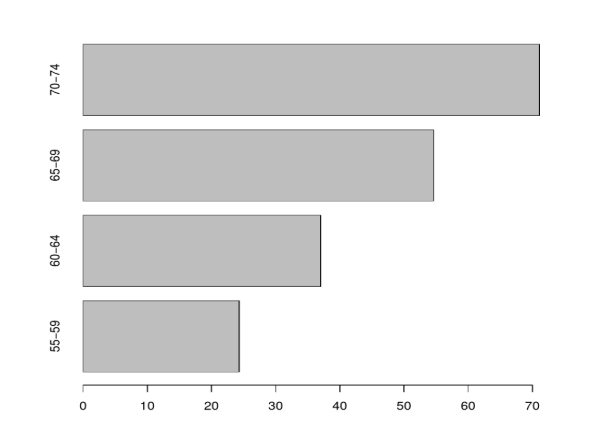
Creating a Bar chart using R built-in data set with a Horizontal bar. To do so, make horiz = TRUE or else vertical bars are drawn when horiz= FALSE (default option).

We shall consider a R data set as:

Rural Male Rural Female Urban Male Urban Female

## 50-54       11.7          8.7       15.4          8.4

## 55-59       18.1         11.7       24.3         13.6

## 60-64       26.9         20.3       37.0         19.3

## 65-69       41.0         30.9       54.6         35.1

## 70-74       66.0         54.3       71.1         50.0

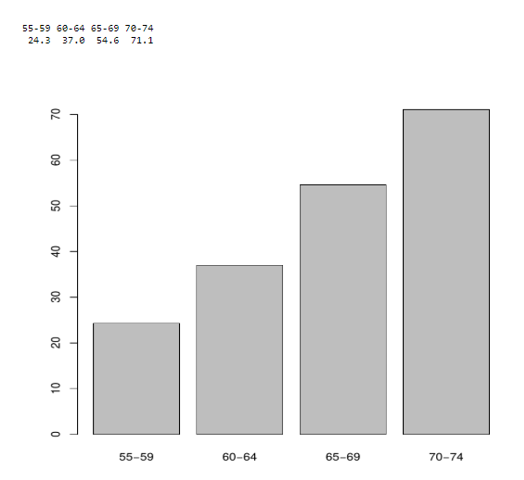
Here comes an example to plot the built-in data set of R.

a<- VADeaths [2:5, "Urban Male"] barplot(a)
# Horizontal bar plot
barplot (a, horiz = TRUE)

Output:

Barchart A

Barchart B

Creating a Bar Chart with Labels & Title

The bar chart could look more elegant by adding more parameters to the bar plot.

Assigning titles and labels

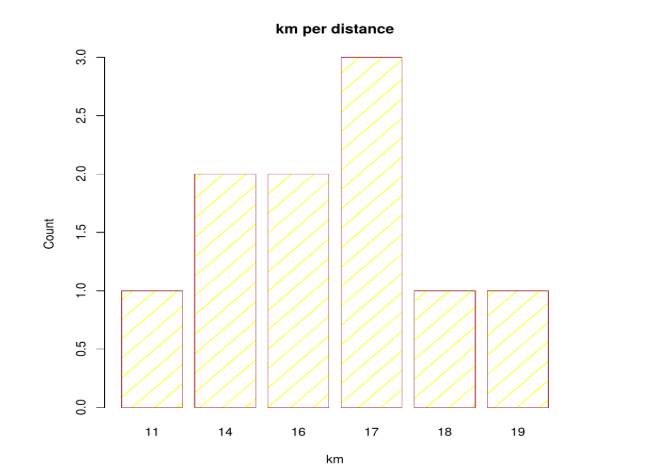
Titles here are assigned using main arguments as “ Km per distance”, and x-axis as “km and y-axis as “ count” (labels) and the parameter col is for adding colors to the bar( either in hexadecimal or RGB format). also, care should be taken a number of bars should be equal to the number of colours assigned in the character vector; if not, the colors get repeated, density is for shading lines on the bars. Titles and labels can be modified and added to the bar charts.

The following example plots kilometer per count using different parameters.

km <- c(11,14,14,16,17,19,17,16,17,18)
table (km)
km
barplot(table(km),
main="km per distance",
xlab="km",
ylab="Count",
border="brown",
col="yellow",
density=5)

Barchart km

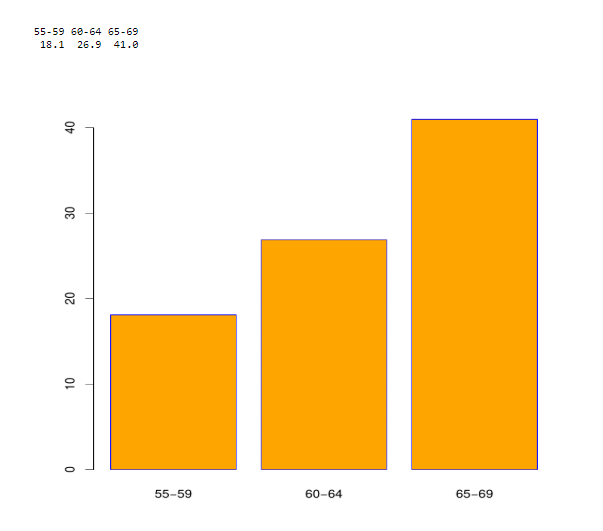
Assigning and changing colors

x <- VADeaths [2:4, "Rural Male"] barplot (x, col = "orange", border = "blue")

The bar chart for the above code is given here:

colour bar

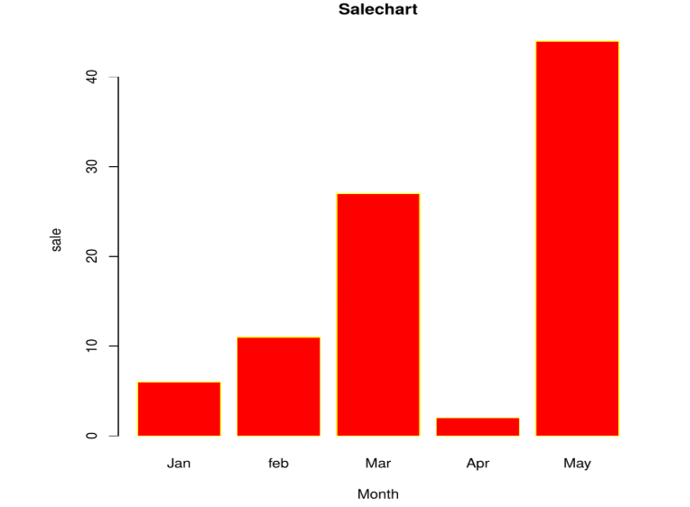
And each of the bars can be assigned different colors. Here, we will fix some labels.

H <- c (6,11,27,2,44)
D <- c("Jan","feb","Mar","Apr","May")
barplot(H,names.arg=D,xlab="Month",ylab="sale",col="Red",main="Salechart",border="yellow")

When executed, we get the following  Output:

Sales chart

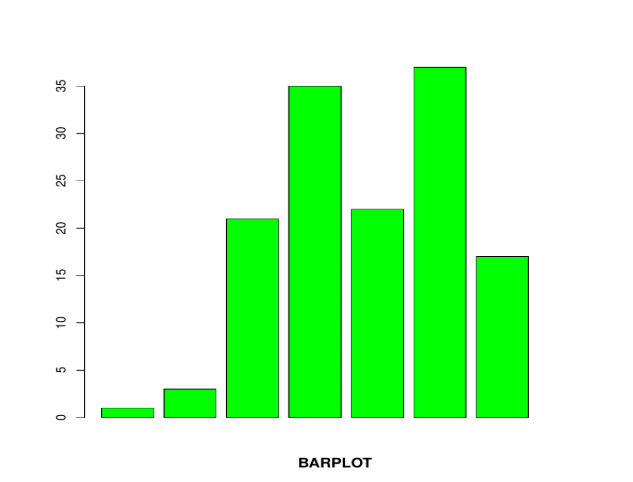
Using various Arguments

B <- c (1, 3, 21, 35, 22, 37, 17)
barplot (B, col="green")
barplot (B, main="BARPLOT", xlab="LETTERS", ylab="VALUES", names.arg=c("A","B","C","D","E","F","G"),
border="yellow", density=c (90, 70, 50, 40, 30, 20, 10))
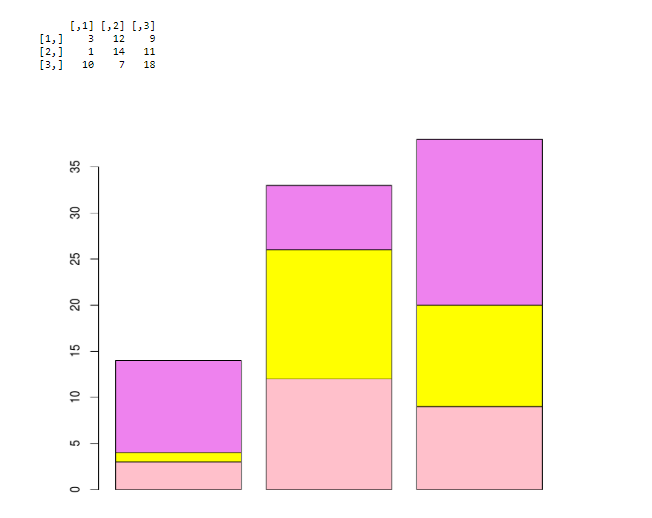
Barplot arg

Barchart km

Using Matrix

mt <- c (3, 1, 10, 12, 14, 7, 9, 11, 18)
val <- matrix (mt, nrow = 3, ncol = 3)
val
barplot (val, col = c ("pink", "yellow", "violet"))

matrix

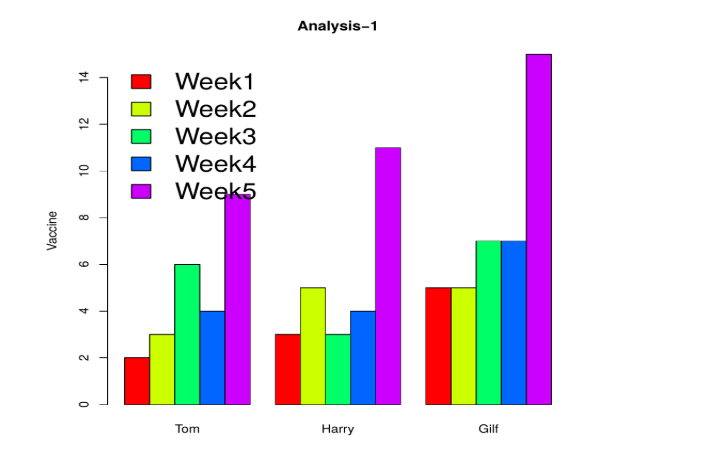
Multiple comparisons

In the below example, we have created a matrix for three vectors representing five points, and a comparison between them is done using a bar chart. Here, we are using the legend function to display the legends. Bty argument is meant for legend borders. The data has been plotted as follows.

A <- c (2,3,6,4,9)
B <- c (3,5,3,4,11)
C <- c (5,5,7,7,15)
data<- data.frame(A, B, C)
names(data)<- c("Tom","Harry","Gilf")
barplot(height=as.matrix(data),main="Analysis-1",ylab="Vaccine", beside=TRUE,col=rainbow (5))
legend ("topleft",c("Week1","Week2","Week3","Week4","Week5"),cex=2.0,bty="n",fill=rainbow (5))
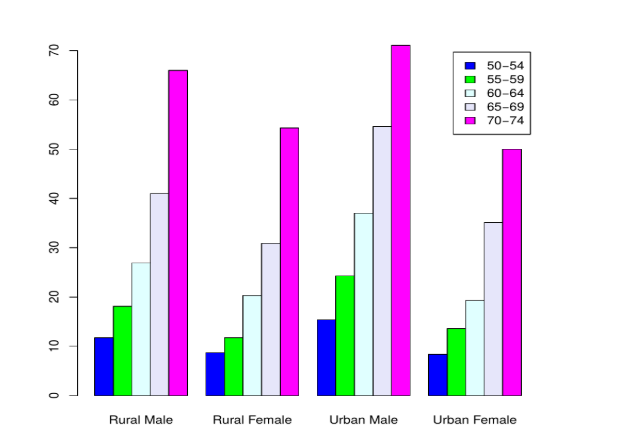
week chart

Grouped Bar Plots

Bar charts are created for all the columns. (columns are grouped together). Group chart makes use of matrix as input values.

barplot (VADeaths,col = c("blue", "green", "lightcyan","lavender", "magenta"),
legend = rownames(VADeaths),beside = TRUE)

Bar Charts in R - groupbar

// Now Making beside = FALSE

barplot (VADeaths, col = c("blue","green","light cyan","lavender","magenta"),
legend = rownames(VADeaths), beside = FALSE)
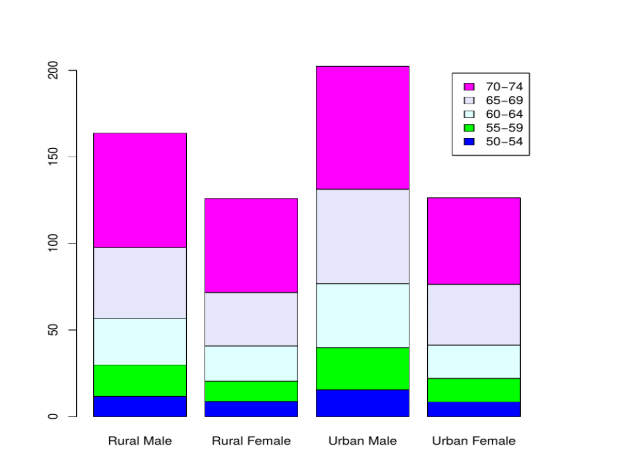
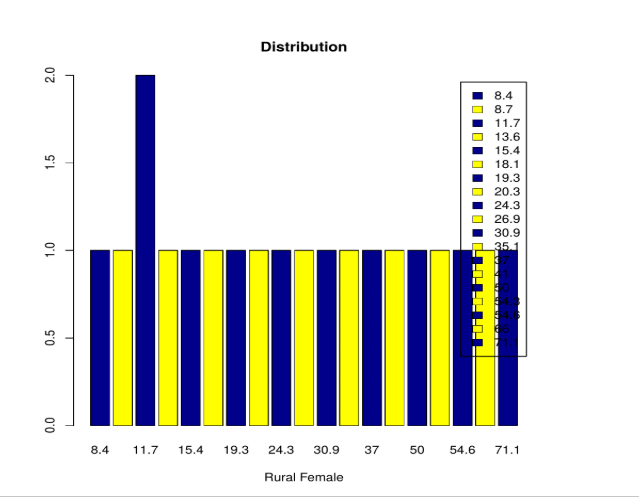
Bar Charts in R - groupbar false

Stacked Bar Plot

Instead of assigning the bars continuously, it is effective to stack them in order.

Example:

counts <- table (VADeaths)
barplot(counts, main="Distribution",
xlab="Rural Female",col=c("darkblue","yellow"), legend = rownames(counts))

Bar Charts in R - distribution bar

Conclusion

Hence, we have discussed the basics of creating bar charts in R. this will help you to understand real-time concepts for quantitative comparison. Bar charts play an essential role in data visualizations. We have seen some real-time scenarios on bar charts for categorical values and monitoring variation of a process for the given data set. New variations of bar charts include plotting using dots. Bar charts help in grouping values at several levels.

Recommended Articles

This has been a guide to Bar Charts in R. Here, we discussed the Basic syntax to create a Bar chart, assigning titles and labels using various Arguments. you may also look at the following articles to learn more –
  1. Gantt chart in Tableau
  2. Binomial Distribution in R
  3. How to Create Pie Chart in R?
  4. Steps to Create a Line Graph in R?
Popular Course in this category
R Programming Training (13 Courses, 20+ Projects)
  13 Online Courses |  20 Hands-on Projects |  120+ Hours |  Verifiable Certificate of Completion
4.5
Price

View Course

Related Courses

Statistical Analysis Training (15 Courses, 10+ Projects)4.9
All in One Data Science Bundle (360+ Courses, 50+ projects)4.8
0 Shares
Share
Tweet
Share
Primary Sidebar
Footer
About Us
  • Blog
  • Who is EDUCBA?
  • Sign Up
  • Live Classes
  • Corporate Training
  • Certificate from Top Institutions
  • Contact Us
  • Verifiable Certificate
  • Reviews
  • Terms and Conditions
  • Privacy Policy
  •  
Apps
  • iPhone & iPad
  • Android
Resources
  • Free Courses
  • Database Management
  • Machine Learning
  • All Tutorials
Certification Courses
  • All Courses
  • Data Science Course - All in One Bundle
  • Machine Learning Course
  • Hadoop Certification Training
  • Cloud Computing Training Course
  • R Programming Course
  • AWS Training Course
  • SAS Training Course

ISO 10004:2018 & ISO 9001:2015 Certified

© 2022 - EDUCBA. ALL RIGHTS RESERVED. THE CERTIFICATION NAMES ARE THE TRADEMARKS OF THEIR RESPECTIVE OWNERS.

EDUCBA
Free Data Science Course

SPSS, Data visualization with Python, Matplotlib Library, Seaborn Package

*Please provide your correct email id. Login details for this Free course will be emailed to you

By signing up, you agree to our Terms of Use and Privacy Policy.

EDUCBA Login

Forgot Password?

By signing up, you agree to our Terms of Use and Privacy Policy.

EDUCBA
Free Data Science Course

Hadoop, Data Science, Statistics & others

*Please provide your correct email id. Login details for this Free course will be emailed to you

By signing up, you agree to our Terms of Use and Privacy Policy.

EDUCBA

*Please provide your correct email id. Login details for this Free course will be emailed to you

By signing up, you agree to our Terms of Use and Privacy Policy.

Let’s Get Started

By signing up, you agree to our Terms of Use and Privacy Policy.

This website or its third-party tools use cookies, which are necessary to its functioning and required to achieve the purposes illustrated in the cookie policy. By closing this banner, scrolling this page, clicking a link or continuing to browse otherwise, you agree to our Privacy Policy

Loading . . .
Quiz
Question:

Answer:

Quiz Result
Total QuestionsCorrect AnswersWrong AnswersPercentage

Explore 1000+ varieties of Mock tests View more