Updated November 23, 2023
Asset Turnover Ratio Formula
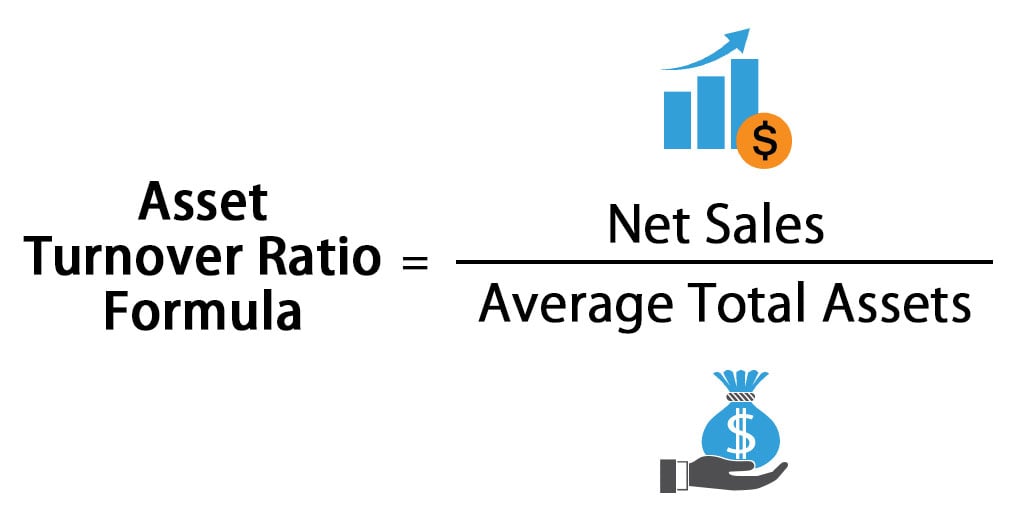
The asset turnover ratio formula is a financial ratio that measures the efficiency of a company in generating revenue from its assets. To calculate the asset turnover ratio, you must divide the company’s net sales by its average total assets for a given period. This ratio indicates how much revenue the company generates per dollar of assets.
The asset turnover ratio formula is:
Asset Turnover Ratio Formula = ———————————
Average Total Assets
Where,
- Net sales are the company’s total revenue from selling goods or services.
- Average total assets are the total value of a company’s assets, including current and fixed assets.
Examples of Asset Turnover Ratio Formula (With Excel Template)
We will start with simple examples and progress to more complex ones. We will calculate the asset turnover ratio for companies like Amazon and Dow Chemicals. Please download the template and keep it open to understand the formulas used in the examples.
Example #1 Retail Business
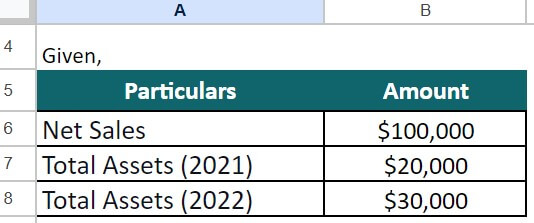
Let’s take an example for Dynamic Firms Ltd, a retail business firm. It has the following data:
- Net Sales = $100,000
- Total Assets for the year 2021 = $20,000
- Total Assets for the year 2022 = $30,000
Calculate and interpret the asset turnover ratio.
Given,
Solution:
As we already know the net sales, we will start by calculating the average total assets and then calculate the asset turnover ratio.
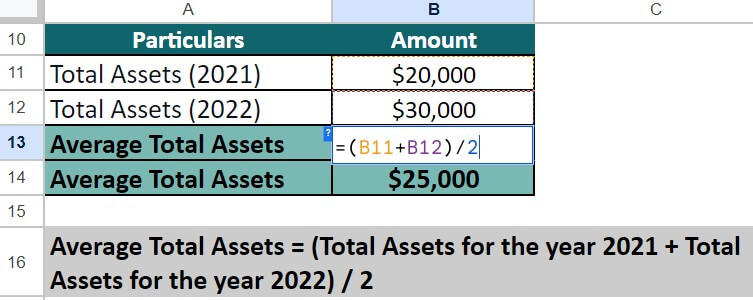
Step #1 Calculate the average total assets
= ($20,000 + $30,000) / 2 = $25,000
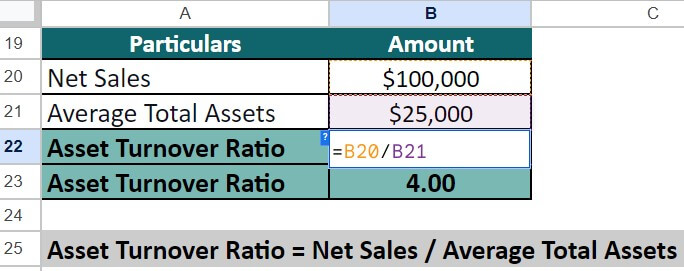
Step #2 Calculate the asset turnover ratio
= $100,000 / $25,000 = 4
Step #3 Interpretation
The asset turnover ratio of 4 indicates that for every $1 Dynamic Firms Ltd. has invested in assets, it generates $4 in sales. In the retail industry, the asset turnover benchmark is 2.5. Thus the company’s asset ratio turnover is higher than the industry average. It signifies that the company has efficient asset management.
Example #2 Restaurant
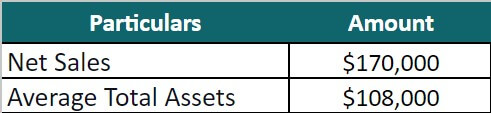
Hailey owns a restaurant named Taste the Best and wants to determine its efficiency in generating sales using its assets (restaurant building, equipment, inventory, etc.). Her net sales for 2022 were $270,000. The average total assets for 2021-2022 were $108,000.
Given,
Solution:
Let us calculate its asset turnover ratio.
Asset Turnover Ratio = Net Sales / Average Total Assets
= $170,000 / $108,000 = 1.57
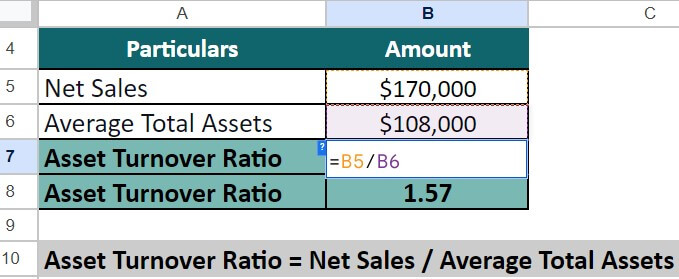
Hailey’s restaurant earns $1.57 for each dollar it has in assets. A good asset turnover ratio is 2.5. Thus the company’s asset ratio turnover is lower than the industry average. It indicates that the company does not have an efficient asset management system.
Real-World Examples
Let us look at a few real company examples like Amazon, SABIC, etc.
Example #1 Amazon Inc.
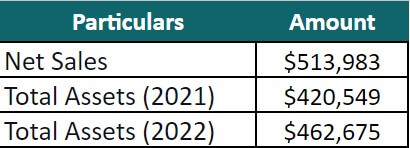
Let us determine the asset turnover ratio for Amazon Inc. We get the data for the year 2021-2022 from its annual report (its income statement and balance sheet).
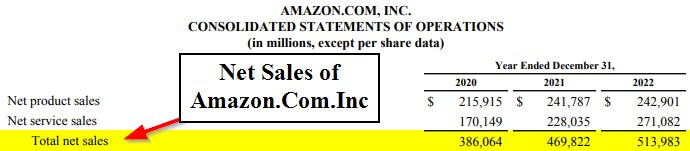
(Image Source: Amazon Annual Report 2022)
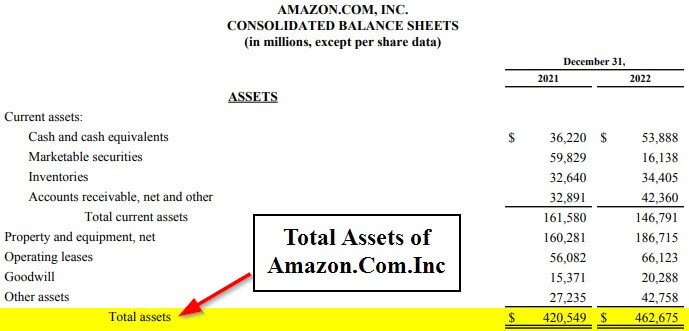
(Image Source: Amazon Annual Report 2022)
Given,
Solution:
First, we will calculate the average total assets and then the asset turnover ratio.
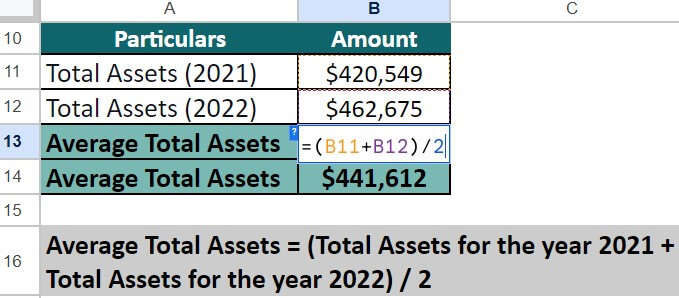
Step #1 Calculate the average total assets
Average Total Assets = (Total Assets for the year 2021 + Total Assets for the year 2022) / 2
= ($420,549 + $462,675) / 2 = $441,612
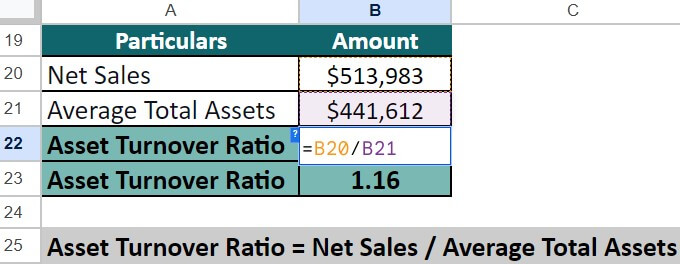
Step #2 Calculate the asset turnover ratio
Asset Turnover Ratio = Net Sales / Average Total Assets
= $513,983 / $441,612 = 1.16
Step #3 Interpretation
Amazon has a 1.16 asset turnover ratio, meaning it generates $1.16 for each $1 asset it owns. The industry average asset turnover ratio for e-commerce businesses is 1.5. It suggests that Amazon generates less revenue per dollar of assets than the industry average.
However, it’s important to note that various factors can influence Amazon’s asset turnover ratio, such as the company’s size, product mix, and competitive landscape, which may differ from other e-commerce companies.
Example #2 SABIC & Dow Chemical
Take a practical example of two companies operating in the petrochemical industry. We take the example of SABIC (Saudi Basic Industries Corporation) and Dow Chemical Company. The table below gives their data for the year 2021-2022 (in millions).
|
Company |
Net Sales (2022) | Total Assets (2021) |
Total Assets (2022) |
| SABIC | $52,917 | $85,160 | $83,490 |
| Dow Chemical Company | $56,902 | $62,990 | $60,603 |
Let us calculate and interpret the results of each company’s asset turnover ratio.
Solution:
We already have the data for the net sales, so let us determine the average total assets to calculate the asset turnover ratio.
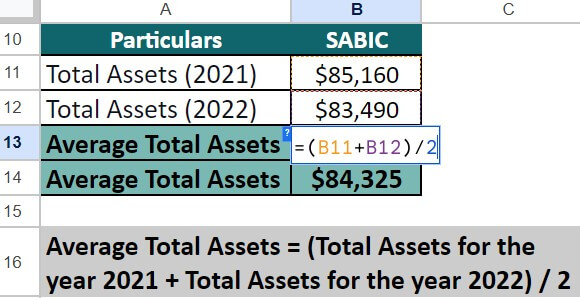
1. SABIC
Step #1 Determine the average total assets
Average Total Assets = (Total Assets for the year 2021 + Total Assets for the year 2022) / 2
= ($85,160 + $83,490) / 2 = $84,325
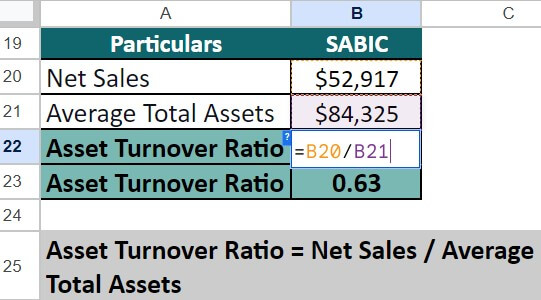
Step #2 Calculate the asset turnover ratio
Asset Turnover Ratio = Net Sales / Average Total Assets
= $52,917 / $84,325 = 0.63
2. Dow Chemical Company
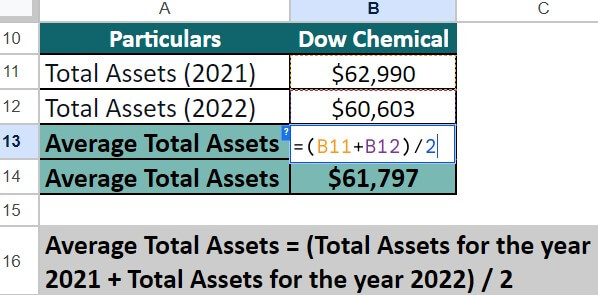
Step #1 Determine the average total assets
Average Total Assets = (Total Assets for the year 2021 + Total Assets for the year 2022) / 2
= ($62,990 + $60,603) / 2 = $61,797
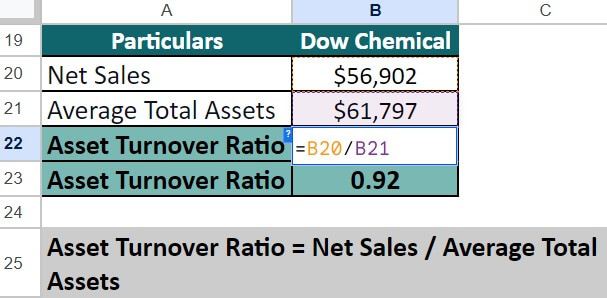
Step #2 Calculate the asset turnover ratio
Asset Turnover Ratio = Net Sales / Average Total Assets
= $56,902 / $61,797 = 0.92
Interpretation:
The industry average asset turnover ratio for the petrochemical (oil and gas) industry is 0.68. Therefore, SABIC has a lower ratio (0.63) than the industry average, while Dow Chemicals has a higher ratio (0.92). Thus, Dow Chemicals is generating more revenue from its assets than SABIC.
Asset Turnover Ratio Formula Calculator
You can use the following Asset Turnover Ratio Formula Calculator.
| Net Sales | |
| Average Total Assets | |
| Asset Turnover Ratio Formula = | |
| Asset Turnover Ratio Formula = | = |
|
|
How to Calculate the Asset Turnover Ratio Formula?
Here are the step-by-step instructions for calculating the asset turnover ratio:
Step #1: Determine the period for which you want to analyze the asset turnover. Companies usually calculate it for either a quarter or the whole financial year.
Example: Global Tech Ltd. wants to compute the asset turnover for the fiscal year 2021-2022.
Step #2: Find the net sales for the period you want to analyze. This information is available on the company’s income statement. It represents the total amount of revenue the company earned during the period.
Example: Global Tech Ltd. has net sales of $1,000,000.
Step #3: Next, determine the average total assets for the period. You can find the total assets on the company’s balance sheet. Otherwise, we can also calculate the average total assets by adding the period’s beginning and ending total assets and dividing the sum by 2.
Example: Global Tech Ltd. has average total assets of ₹500,000.
Step #4: Now, let us calculate the asset turnover ratio by dividing the net sales by the average total assets.
Example: The asset Turnover Ratio for Global Tech Ltd. will be 2 ($1,000,000 / $500,000).
Step #5: We interpret the results after calculating the asset turnover ratio.
Example: Global Tech Ltd. generated $2 in revenue for every $1 of its assets. It indicates better efficiency in using assets to generate revenue.
What is a Good Asset Turnover Ratio? – Interpretation
A good asset turnover ratio varies by industry, but a higher ratio is generally better. However, another factor for companies operating in the same industry is that sometimes a company with older assets will have higher asset turnover ratios since the accumulated depreciation would be more. Hence, while comparing asset turnover ratios for companies operating in the same industry, we should also consider this factor.
Interpretation of the Ratio
High Ratio:
- A higher ratio for asset turnover is a good sign that the company is using its assets efficiently.
- For example, a high asset turnover ratio for a retailer would indicate that the company is efficiently using its inventory and other assets to generate sales.
Low Ratio:
- A lower ratio indicates that the company is not using its assets efficiently.
- It could indicate that the company is not generating enough revenue from its assets, leading to lower profitability and financial performance.
- However, a company may intentionally keep its assets low to maintain financial flexibility and reduce its dependence on fixed assets. A lower asset turnover ratio can be a good thing in this case.
Use of Asset Turnover Ratio Formula in Dupont Analysis
One of the asset turnover ratio formula’s usage is DuPont Analysis. The DuPont Analysis calculates the Return on Equity of a firm and uses profit margin, asset turnover ratio, and financial leverage to calculate RoE.
DuPont analysis breaks down the return on equity (ROE) into components to help analyze a company’s financial performance.
The formula for DuPont analysis is as follows:
Using the asset turnover ratio in DuPont analysis, investors and analysts can gain insight into the company’s efficiency in utilizing its assets to generate sales revenue.
Suppose the asset turnover ratio is declining over time. In that case, it may suggest that the company is becoming less efficient in using its assets to generate revenue, which can affect the overall return on equity.
Therefore, the asset turnover ratio is an essential component of DuPont analysis, which provides a comprehensive understanding of a company’s financial performance.
Example
BPCL has a profit margin of 10%, financial leverage of 1.5, and asset turnover of 2.87. The ROE using the following formula will be,
RoE = Profit Margin x Asset Turnover x Financial Leverage
= 0.1 x 2.87 x 1.5 = 0.4305 or 43.05%
BPCL’s ROE of 43.05% is impressive, with a high asset turnover ratio of 2.87 driving it. The high asset turnover ratio suggests that the company utilizes its assets effectively to generate sales, which is a positive sign for investors.
How to Improve Asset Turnover Ratio?
There are several strategies that companies can use to improve their asset turnover ratio, including:
1. Investing in more efficient equipment:
Companies can increase their production capacity and reduce operating costs by investing in more efficient equipment.
2. Selling unproductive assets:
Companies can sell unproductive assets, such as underutilized equipment or unused real estate, to free up capital.
3. Improving inventory management:
Companies can free up working capital and improve their asset turnover by better managing their inventory levels and reducing excess or obsolete inventory.
4. Streamlining operations:
Optimize production and supply chain processes to reduce the time and resources required to produce and sell their products.
5. Increasing marketing efforts:
Companies can increase their marketing efforts to generate more product demand, which can help increase sales.
Asset Turnover vs. Fixed Asset Turnover Ratio
|
Basis |
Asset Turnover Ratio |
Fixed Asset Turnover Ratio |
| Definition | Measures the efficiency of generating revenue from all assets. | Measures the efficiency of generating income from fixed (long-term) assets. |
| Formula | Net Sales / Average Total Assets | Net Sales / Average Fixed Assets |
| Focus | Overall asset utilization and revenue generation | Utilization of long-term assets and revenue generation |
| Interpretation | Indicates how efficiently all assets are generating revenue | Indicates how efficiently fixed assets are generating revenue |
| Considerations | Includes both current and fixed assets | Focuses solely on fixed assets |
| Significance | Reflects the company’s ability to generate revenue from its entire asset base | Indicates the effectiveness of utilizing long-term assets in revenue generation |
Importance and Uses of Asset Turnover Ratio Formula
Here are some key importance and uses of the asset turnover ratio formula:
1. Efficiency measurement: The ratio helps evaluate how effectively the company utilizes its asset investment to generate sales, highlighting operational efficiency.
2. Trend analysis: Monitoring changes in the asset turnover ratio over time helps assess the company’s performance trends. A consistently improving ratio indicates better asset utilization and operational efficiency.
3. Investment decision-making: The ratio provides insights into a company’s ability to generate revenue and optimize its asset base, aiding investors in making informed investment decisions.
4. Cross-sectional analysis: The asset turnover ratio formula can help identify areas of the business that are performing well or need improvement in terms of asset utilization and revenue generation.
Limitations of Asset Turnover Ratio Formula
While the asset turnover ratio is a valuable financial metric, it has certain limitations:
1. Industry differences: Industries vary widely in asset requirements and business models. Comparing asset turnover ratios across industries may not provide meaningful insights, as industries have different asset turnover benchmarks.
2. Size and age of assets: The asset turnover ratio does not differentiate between new and old assets. Older assets may have lower productivity and efficiency, potentially affecting the ratio.
3. Seasonality and cyclical nature: Certain industries experience seasonal fluctuations, affecting the asset turnover ratio. Thus, comparisons should be made over comparable periods or adjusted for seasonality to get a more accurate picture.
4. Non-operational assets: The asset turnover ratio formula considers total assets, which may include non-operational or non-core assets. These assets may not contribute to revenue generation, leading to an inflated turnover ratio.
Recommended Articles
This is a guide to the Asset Turnover Ratio formula, where we discuss it using practical, real-world examples (with a downloadable Excel template). Please refer to the following articles to learn more –
