Updated November 24, 2023
Asset to Sales Ratio Formula (Table of Contents)
- Asset to Sales Ratio Formula
- Asset to Sales Ratio Calculator
- Asset to Sales Ratio Formula in Excel (With Excel Template)
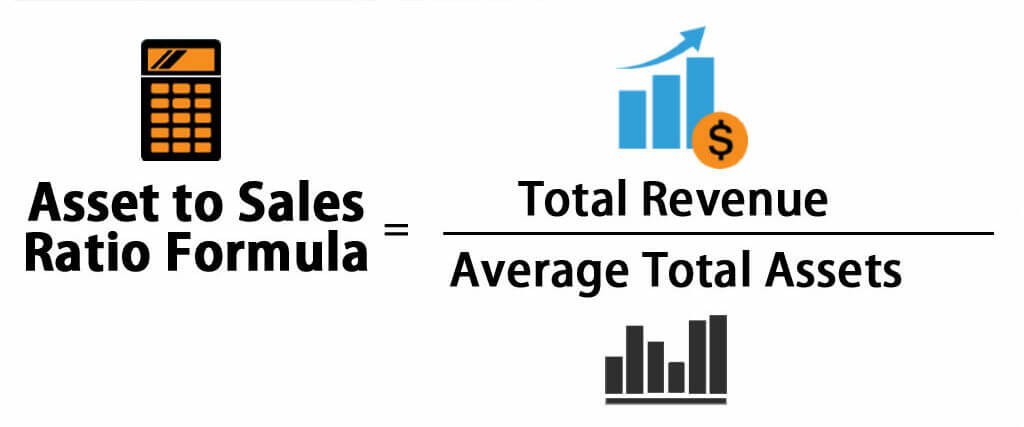
Asset to Sales Ratio Formula
An asset to sales ratio is one of the primary ratios used to determine the company’s efficiency. It shows how a company generates revenue by managing its assets and their correlation. A higher asset-to-revenue ratio indicates higher profitability with low investment.
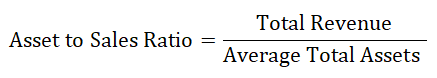
The Formula for Asset to Sales Ratio is
Where,
Average Total Assets is calculated as:
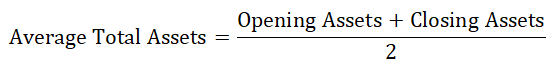
Average total assets are taken into account because most companies choose capital investment during the year, and to take a median of assets utilized for generating the entire revenue throughout the year average of opening and closing total assets are taken into account.
Assets can be built using shareholders’ equity as well as borrowed funds. The base considers the sum of the borrowed amount and shareholders’ funds when determining the business revenue.
Examples of Asset to Sales Ratio Formula
Let’s take an example to find out the Asset to Sales Ratio for a company: –
Asset to Sales Ratio Formula – Example #1
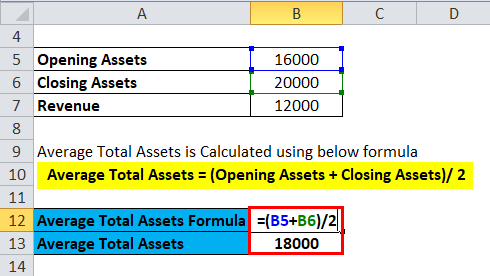
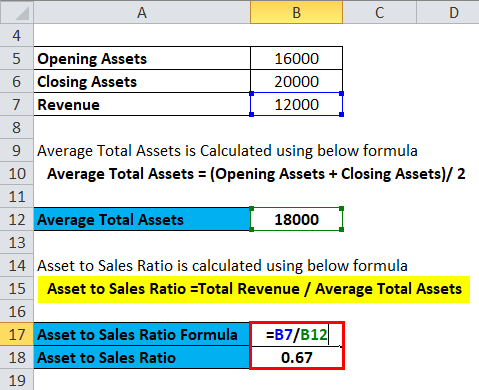
X Ltd. has a closing Asset in its Balance Sheet at INR 20000, and its opening balance stands at INR 16000. Revenue stands at INR 12000. Find the Asset to Revenue of the Business?
- The total assets of the company at the beginning (opening balance) of the year INR 16000
- The total assets of the company at the end (closing balance) of the year INR 20000
- The total revenue of the company stands at INR 12000
Average Total Assets is Calculated using the below formula
- Average Total Assets = (Opening Assets + Closing Assets)/ 2
- Average Total Asset of X ltd = INR (16000+20000) /2
- Average Total Asset of X ltd = 36,000 / 2
- Average Total Asset of X ltd = INR 18000
Asset to Sales Ratio is calculated using the below formula
- Asset to Sales Ratio =Total Revenue / Average Total Assets
- Asset to Sales Ratio = 12000/ 18000
- Asset to Sales Ratio = 0.66 or 66.66%
To conclude, for every 1 rupee Investment, the company can generate 0.66 or 66% of the total investment.
Asset to Sales Ratio Formula – Example #2
The Consolidated income of Nocil Ltd for FY17 and FY18 is INR 751.73 Cr and INR 982.19 Cr, respectively. In contrast, the company’s Total assets during these periods stood at INR 1,160.94 Cr and INR 1,347.69 Cr. respectively. Find the asset to Sales of the company for FY18.
- Total Assets of the company at the beginning (opening balance) INR 1,160.94 Cr
- The total asset of the company at the end (closing balance) of the year is INR 1,347.69 Cr.
- The total revenue (FY18) of the company stands at INR 982.19 Cr
Average Total Assets is Calculated using the below formula
- Average Total Assets = (Opening Assets + Closing Assets)/ 2
- Average Total Asset of Nocil Ltd = INR (1160.94 +1347.69) /2
- Average Total Asset of Nocil Ltd = INR 2508.63 Cr /2
- Average Total Asset of Nocil Ltd = INR 1254.315 Cr
Asset to Sales Ratio is calculated using the below formula
- Asset to Sales Ratio =Total Revenue / Average Total Assets
- Asset to Sales Ratio= INR 982.19 / 1254.315 Cr
- Asset to Sales Ratio = 0.78. Or 78.3%
Thus to conclude, the company generates 78 paise for every INR investment into the company.
Asset to Sales Ratio Formula – Example #3
The Consolidated Income of Sunteck Realty Ltd for FY17 and FY18 is INR 960.36 Cr and INR 897.56 Cr, respectively. In contrast, the company’s Total assets during these periods stood at INR 3678.62 Cr and INR 3656.33 Cr. respectively. Find the asset to Sales of the company for FY18.
- Total Asset of the company at the beginning (opening balance) INR 3678.62 Cr
- The total asset of the company at the end (closing balance) of the year is INR 3656.33 Cr.
- The total revenue (FY18) of the company stands at INR 897.56 Cr
We calculate the Average Total Assets using the following formula
- Average Total Assets = (Opening Assets + Closing Assets)/ 2
- Average total asset of Sunteck Realty Ltd = INR (3678.62+3656.33) /2
- Average total asset of Sunteck Realty Ltd = INR 7334.95 Cr /2
- The average total asset of Sunteck Realty Ltd = INR 3667.475 Cr.
We calculate the Asset to Sales Ratio using the following formula
- Asset to Sales Ratio = Total Revenue / Average Total Assets
- Asset to Sales Ratio = INR 897.56 / 3667.475 Cr
- Asset to Sales Ratio = 0.244 or 24.47%
Thus to conclude, the company generates 24 paise for every INR investment into the company.
Explanation
This Asset to Sales Ratio formula measures the particular company’s efficiency in terms of operating performance. The amount of revenue generated from its existing assets is an Indicator of the business’s health. In peer analysis, it is common to use the Asset to Sales Ratio for comparing different companies within the same sector. The higher the ratio, the better the operating efficiency of the management. Higher revenue denotes better product acceptability and better business competitive advantage than its competitors. The management of the company would get to know about the primary operating assets, and they would probably concentrate on Restructuring using Asset Sales to improve the ratio and as well as lower the cost of borrowings(In case the Assets are purchased on behalf of Borrowed capital), several expenses like Depreciation, maintenance expense, servicing expense, etc.
Significance and Use of Asset to Sales Ratio Formula
- The day’s sales to revenue show how quickly the stock of a particular business is churning, or in other words, what is the demand for the product?
- The Creditors, the Loan provider, or the Financial Institution who are associated with the company would be able to know about the manufacturing status and the capacity utilization of the particular business and get to know about the financial health of the company.
- The management can forecast the current scenario and expected strategies, and, last but not least, they can communicate with third parties using the sales figures and capacity addition.
- A company has to incur several expenses on its assets, such as maintenance, Depreciation, repayment, etc. So if a company has a lower Asset-to-sales ratio, and the ratio drops every financial year, it has to restructure its operating Assets to narrow its costs and improve margin. Sell of unwanted assets would lower the denominator of the ratio, and the Asset to Sales figure would look healthy.
- Analysts pay utmost attention to this particular ratio before they recommend the stock for buying by Investors. This is one of the primary criteria (based on the specific industry) to determine the competitiveness of a business. The diminishing Asset to Sales ratio indicates low business viability and low competence of the management.
- Last but not least, the head-to-head comparison would indicate the product earning capacity of different businesses, the cycle of the company, and the economic scenario based on the
Asset to Sales Ratio Calculator
You can use the following Asset to Sales Ratio Calculator
| Total Revenue | |
| Average Total Assets | |
| Assets to Sales Ratio Formula | |
| Assets to Sales Ratio Formula | = |
|
|
Asset to Sales Ratio Formula in Excel (With Excel Template)
Here, we will do the same Excel example of the Asset to Sales Ratio formula. It is very easy and simple. You need to provide the two inputs, i.e., Total Revenue and Average Total Assets
You can easily calculate the Asset to Sales Ratio using the formula in the template provided.
First, we calculate the Average Total Assets
We calculate the Asset to Sales Ratio using the following formula
Recommended Articles
This has been a guide to an Asset to Sales Ratio formula. Here, we discuss its uses along with practical examples. We also provide an Asset to Sales Ratio Calculator with a downloadable Excel template. You may also look at the following articles to learn more –
