Updated May 26, 2023
Adjusted R Squared Formula (Table of Contents)
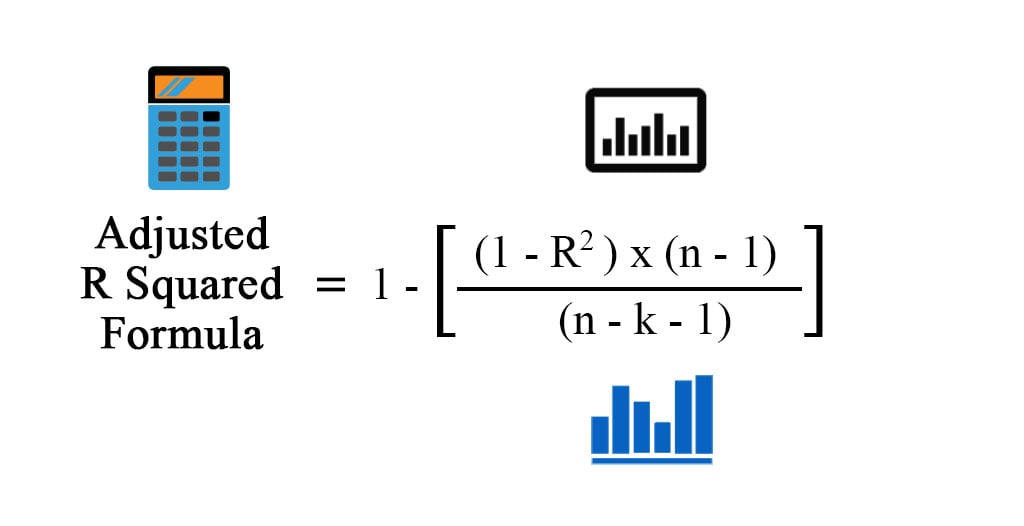
Adjusted R Squared Formula
Before jumping to the adjusted r-squared formula, we must understand what R2 is. In statistics, R2, also known as the coefficient of determination, is a tool that determines and assesses the variation in the dependent variable explained by an independent variable in a statistical model. So if R2 is said 0.6, it means that the independent variable explains 60% of the variation in the dependent variable. The problem with R2 is its value increases with adding more variables, irrespective of the significance of the variable. So to overcome that, the concept of adjusted r square has been introduced. The idea behind R2 and adjusted R Squared is the same, but the difference is that adjusted r squared adjusts the r square value for the number of terms in the model.
Formula For Adjusted R Squared:
Before we calculate adjusted r squared, we need r square first. There are different ways to calculate r square:
- Using Correlation Coefficient :
Correlation Coefficient = Σ [(X – Xm) * (Y – Ym)] / √ [Σ (X – Xm)2 * Σ (Y – Ym)2]
Where:
- X – Data points in data set X
- Y – Data points in data set Y
- Xm– Mean of data set X
- Ym– Mean of data set Y
So
R2 = (Correlation Coefficient)2
Where:
- n – Number of points in your data set.
- k – Number of independent variables in the model, excluding the constant
- Using Regression outputs
R2 = Explained Variation / Total Variation
R2 = MSS / TSS
R2= (TSS – RSS) / TSS
Where:
- TSS – Total Sum of Squares = Σ (Yi – Ym)2
- MSS – Model Sum of Squares = Σ (Y^ – Ym)2
- RSS – Residual Sum of Squares =Σ (Yi – Y^)2
Y^ is the predicted value of the model, Yi is the ith value, and Ym is the mean value
Examples of Adjusted R Squared Formula (With Excel Template)
Let’s take an example to understand the calculation of the Adjusted R Squared in a better manner.
Adjusted R Squared Formula – Example #1
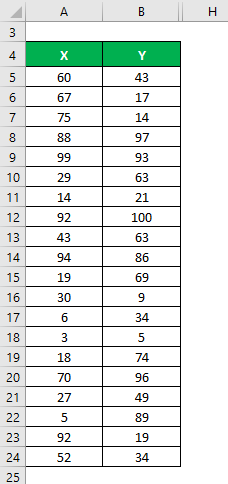
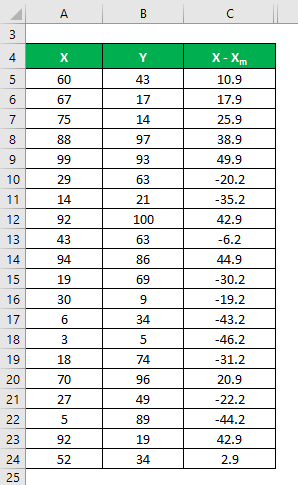
Let’s say we have two data sets, X & Y, each containing 20 random data points. First, calculate the Adjusted R Squared for the data set X & Y.
Related Courses
Finance for Non-Finance Managers Course (7 Courses)Investment Banking Course (123 Courses, 25+ Projects)Financial Modeling Course (7 Courses, 14 Projects)
The mean is calculated as follows:
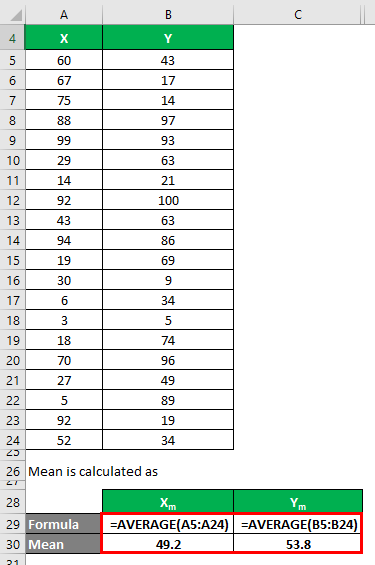
- Mean of Data Set X = 49.2
- Mean of Data Set Y = 53.8
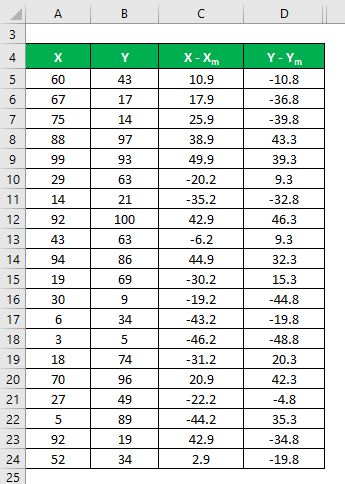
We must calculate the difference between the data points and the mean value.
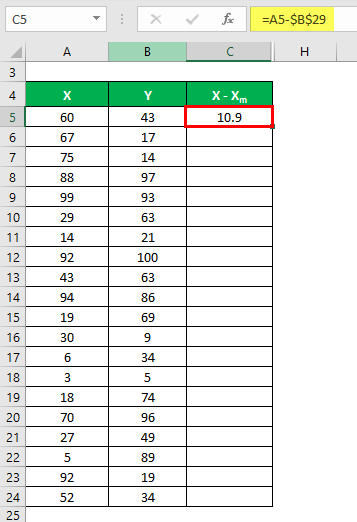
Similarly, calculate for all the data sets of X.
Similarly, calculate it for data set Y also.
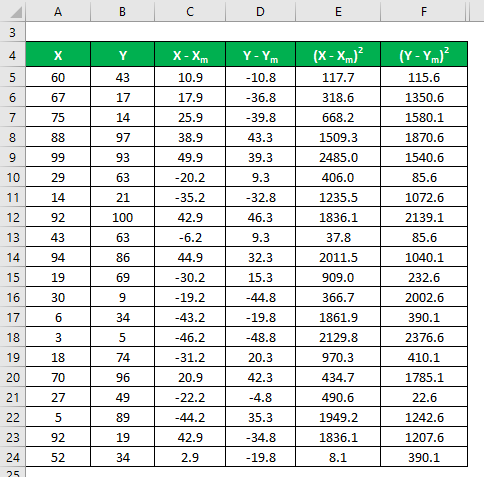
Calculate the square of the difference for both the data sets, X and Y.
Multiply the difference in X with Y.
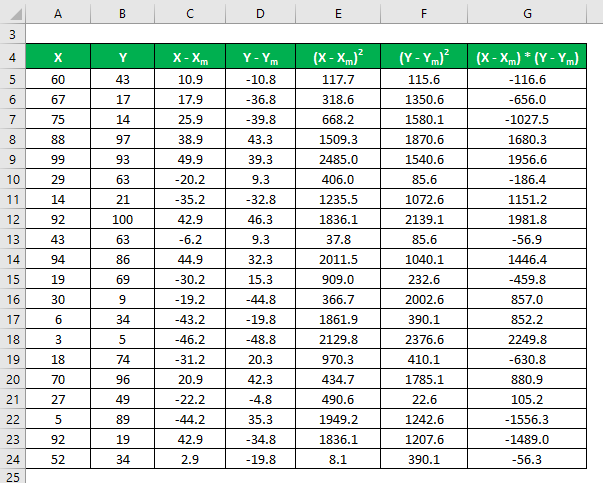
The correlation coefficient is calculated using the formula given below
Correlation Coefficient = Σ [(X – Xm) * (Y – Ym)] / √ [Σ (X – Xm)2 * Σ (Y – Ym)2]
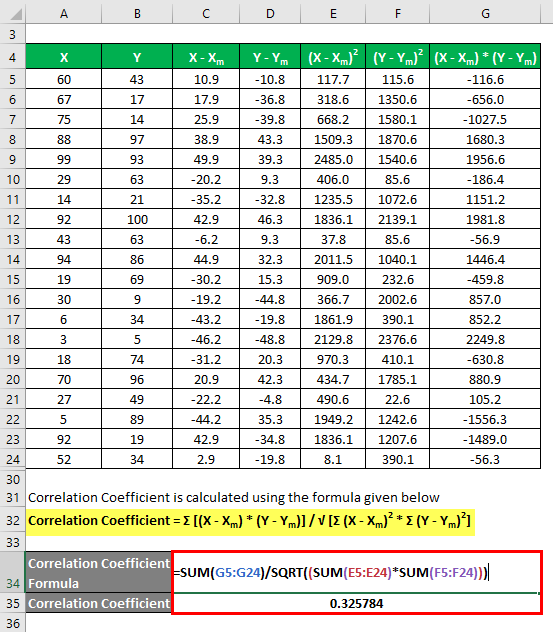
Correlation Coefficient = 0.325784
To calculate R2, you can use the following formula:
R2 = (Correlation Coefficient)2
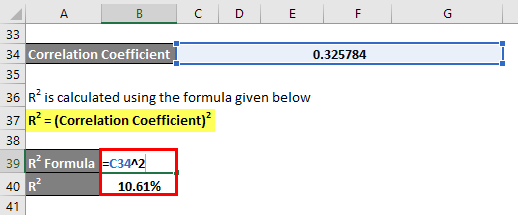
R2 = 10.61%
Adjusted R Squared is calculated using the formula given below
Adjusted R Squared = 1 – [((1 – R2) * (n – 1)) / (n – k – 1)]
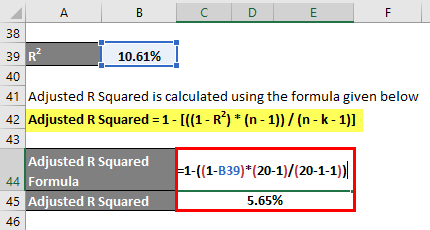
- Adjusted R Squared = 1 – ((1 – 10.61%) * (20 – 1)/(20 – 1 – 1))
- Adjusted R Squared = 5.65%
Adjusted R Squared Formula – Example #2
Let’s use another method to calculate the r square and then adjust the r squared. Let’s say you have actual and predicted dependent variable values with you ( Y and Y^):
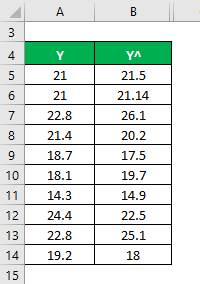
The mean is calculated as
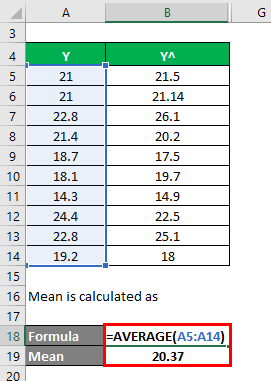
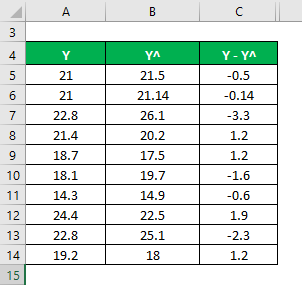
We need to calculate the difference between actual and predicted dependent variable values.
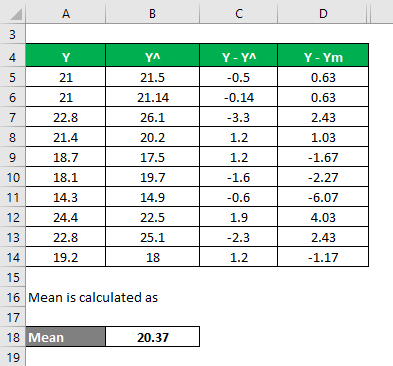
Calculate the difference between the data points and the mean value.
Calculate the square of the differences.
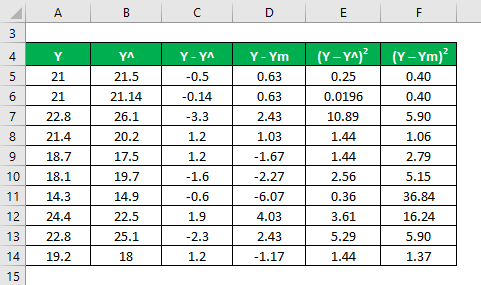
R2 is calculated using the formula given below
R2 = (TSS – RSS) / TSS
- TSS = Σ (Y – Ym)2
- RSS = Σ (Y – Y^)2
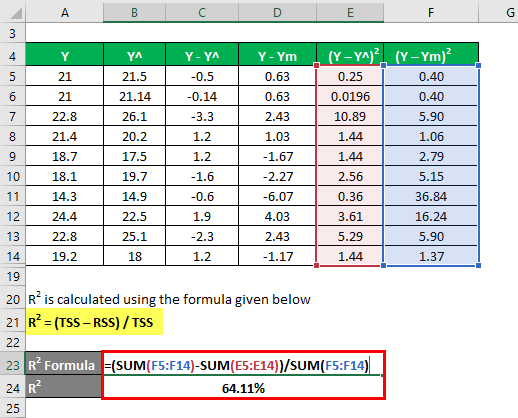
R2 = 64.11%
Let’s say we have 3 independent variables: i.e., k=3.
To calculate the adjusted R-squared, you can use the following formula
Adjusted R Squared = 1 – [((1 – R2) * (n – 1)) / (n – k – 1)]
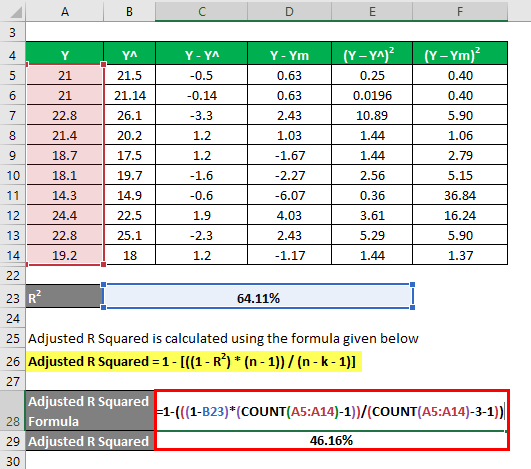
- Adjusted R Squared = 1 – (((1 – 64.11%) * (10-1)) / (10 – 3 – 1))
- Adjusted R Squared = 46.16%
Explanation
As explained above, R2, or the coefficient of determination, is the square of the correlation between 2 data sets. If R2 is 0, there is no correlation, and the independent variable cannot predict the value of the dependent variable. Similarly, if its value is 1, the independent variable will always be successful in predicting the dependent variable. But there are some limitations also. As the number of independent variables increases in the statistical model, the R2 also increases whether the new variables make sense. That is why adjusted r squared is calculated since it adjusts the R2 value for that increase in several variables. Adjusted r-squared value decreases if that independent variable is not significant and increases if that has significance.
Relevance and Uses of R Squared Formula
Adjusted r squared is more useful when we have more than 1 independent variable since it adjusts the r square and takes only into consideration the relevant independent variable, which explains the variation in the dependent variable. Therefore, its value is always less than the R2 value. This tool generally has many practical applications like comparing portfolio performance with the market and future prediction, risk modeling in Hedge Funds, etc.
Recommended Articles
This is a guide to the Adjusted R Squared Formula. Here we have discussed how to calculate the Adjusted R Squared Formula along with practical examples and a downloadable Excel template. You may also look at the following articles to learn more –
