Updated July 28, 2023
R – Squared Formula (Table of Contents)
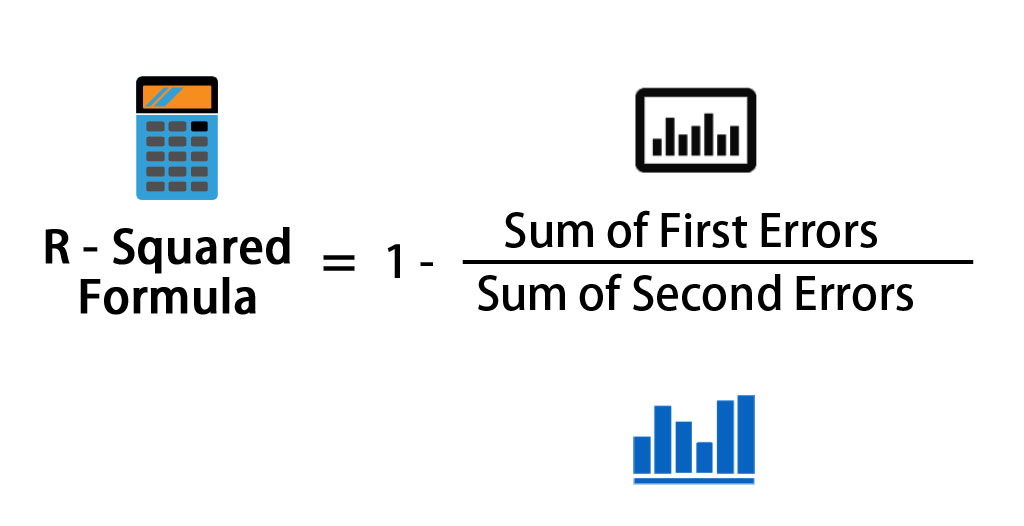
R – Squared Formula
The R-squared formula is also known as the coefficient of determination; it is a statistical measure which determines the correlation between an investor performance and the return or the performance of the benchmark index.
It basically shows what degree to a stock or portfolio performance can be attributed to a specific benchmark index. This formula is slightly different from a correlation of variable because the correlation formula shows the relationship between the dependent and the independent variable, whereas on the other hand, the R -squared formula shows to what extent the variance of one variable explains the variance of the second variable.
A formula for R – Squared is given by:
Examples of R – Squared Formula (With Excel Template)
Let’s take an example to understand the calculation of R – Squared in a better manner.
Example #1
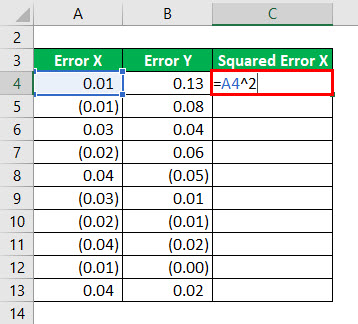
Consider the following information, and calculate the R Squared.
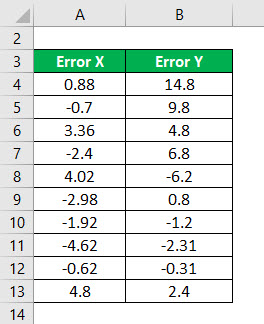
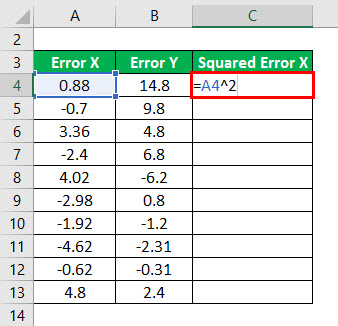
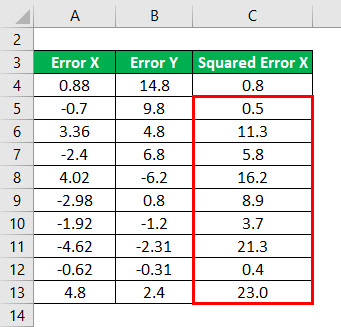
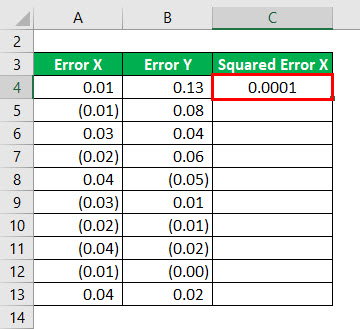
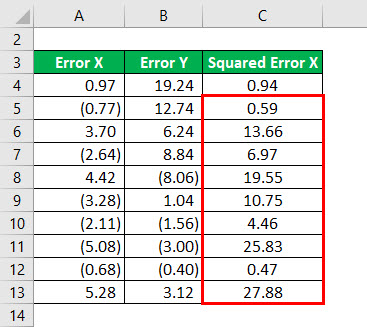
Square of error X will be calculated as:
The result will be as given below.
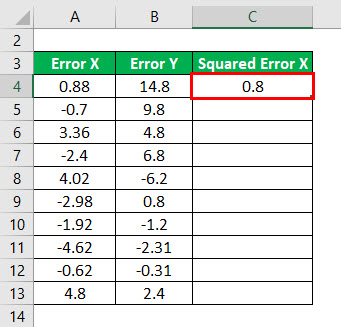
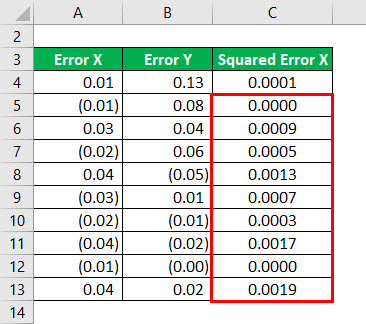
Square of error X for all the data as given below.
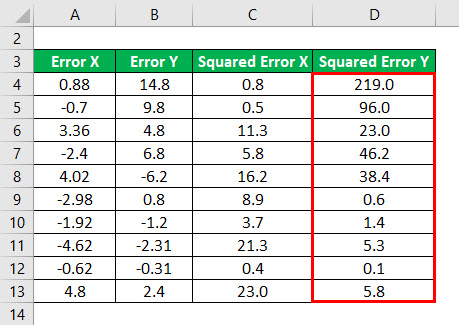
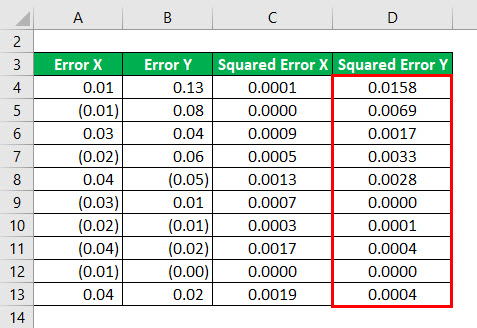
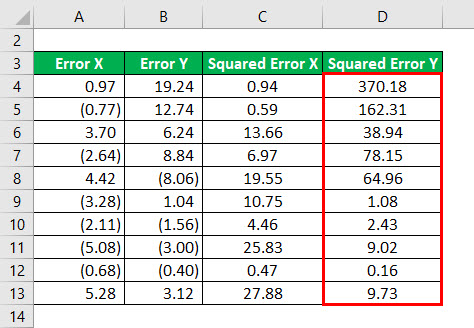
Similarly, We have to calculate the Square of error Y for all the data.
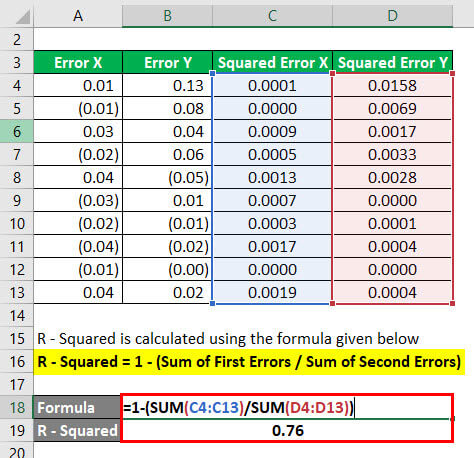
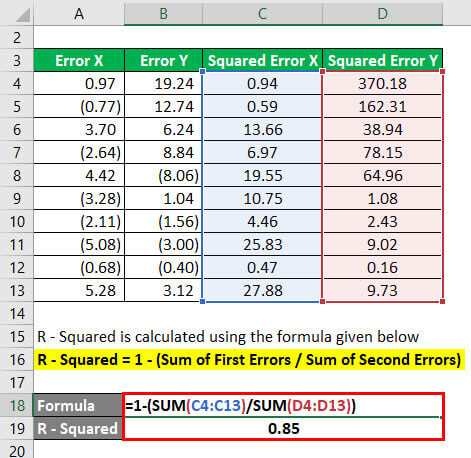
R – Squared is calculated using the formula given below
R – Squared = 1 – (Sum of First Errors / Sum of Second Errors)
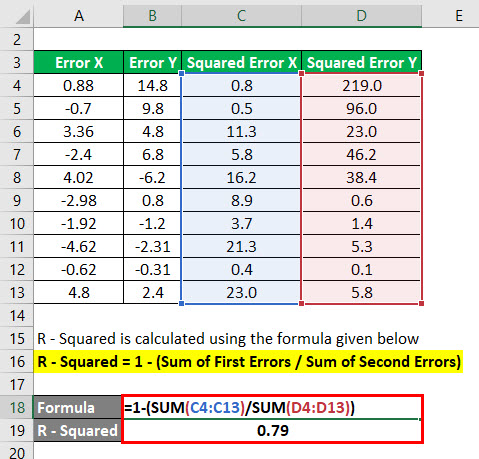
Here first, we have squared the error of the following points and have done a summation of the above problems. After that, the sum of the first error is divided by the sum of the second error and is subtracted by 1.
The R-squared lies within the range of 0 to 1. An r -squared off 1 or 100% signifies that all the movements in the index are completely explained by the movements in the benchmark index.
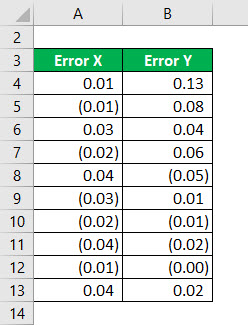
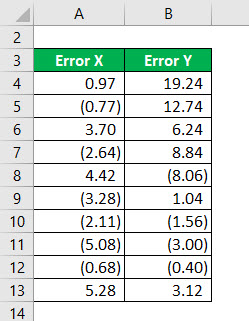
Example #2
Consider the following information, and calculate the R Squared.
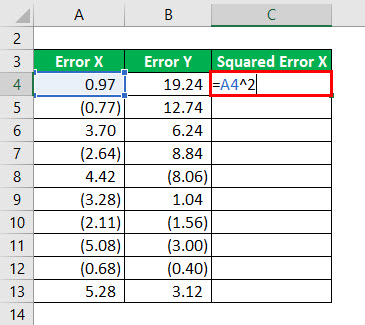
Square of error X will be calculated as:
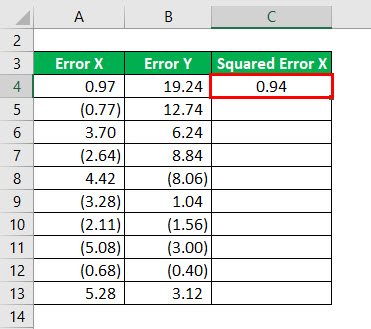
The result will be as given below.
Squared of error X for all the data as given below.
Similarly, We have to calculate the Squared of error Y for all the data.
R – Squared is calculated using the formula given below
R – Squared = 1 – (Sum of First Errors / Sum of Second Errors)
Example #3
Consider the following information, and calculate the R Squared.
Squared of error X will be calculated as:
The result will be as given below.
Squared of error X for all the data as given below.
Similarly, We have to calculate the Squared of error Y for all the data.
R – Squared is calculated using the formula given below
R – Squared = 1 – (Sum of First Errors / Sum of Second Errors)
Relevance and Uses
- This formula is widely being used by portfolio managers and fund managers as a measure that tells how the funds movements correlate with the benchmark index.
- This formula is also used in the stock market industry, which tells the broker or the investor how well the stock is correlating with the overall movement of the market.
- This formula has its own limitations as it cannot judge whether the coefficient estimates and the predictions are biased or not; hence, you just need to assess the residual plots.
- Where R – Squared does not serve as a good comparison model to compare the goodness of the two variable, an R- Squared adjusted is used most of the time to do multiple linear regressions.
- A low or high R- the squared number cannot always be good or bad as it does not tell the user the reliability of the model.
- If the user has a low R-squared value, but the independent variables are statistically significant, the user can still draw important conclusions about the relationships between the variables.
R – Squared Calculator
You can use the following R – Squared Calculator
| Sum of First Errors | |
| Sum of Second Errors | |
| R - Squared Formula | |
| R - Squared Formula = | 1 -(Sum of First Errors / Sum of Second Errors) |
| = | 1 -(0 / 0) = 0 |
Recommended Articles
This has been a guide to R – Squared Formula. Here we discuss how to calculate R – Squared along with practical examples. We also provide R – Squared calculator with a downloadable Excel template. You may also look at the following articles to learn more –
