Updated June 8, 2023
Z Score in Excel
z score in Excel is used for statistical measurement. It is also known as a standard score. The value of the Z score measures the number of standard deviations a specific number is above or below a mean.
The below formula is used to calculate the Z score:
Z = (x-µ) / σ
Where the supplied arguments are as below:
- Z = It denotes the Z score value.
- X = The value to be standardized.
- µ = Mean of the given data set values.
- σ = Standard deviation of the given data set values.
How to Calculate Z Score in Excel?
Calculation of the Z Score in Excel is very simple and easy. Let’s understand how to calculate the Z score in Excel with some examples.
Excel Z Score – Example #1
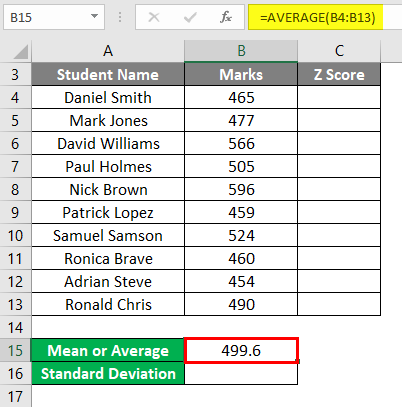
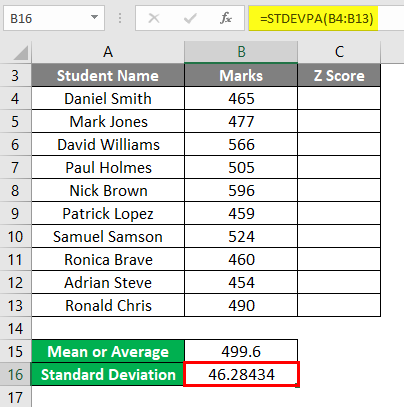
We have given marks to some students as below:
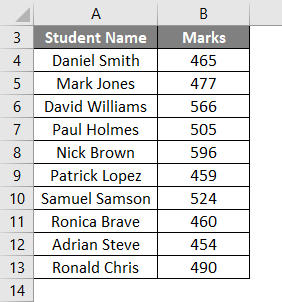
Now for calculating Z Score, we need to find out the Mean and standard deviation of the given dataset in Excel.
Mean (or Average) calculation:
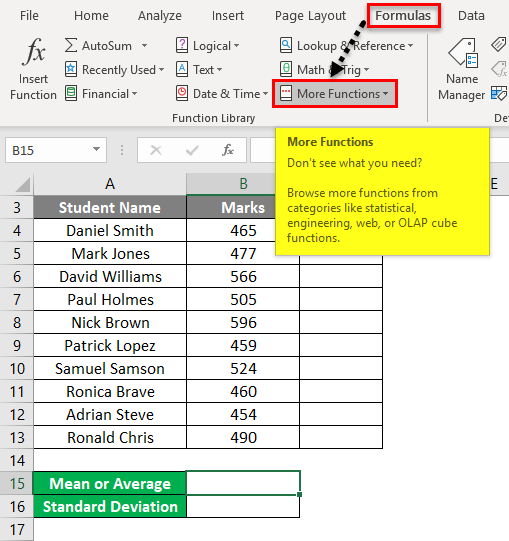
To find the average, follow the below steps:
Step 1 – Go to the Formulas tab. Click on the More Functions options under the Functions Library section.
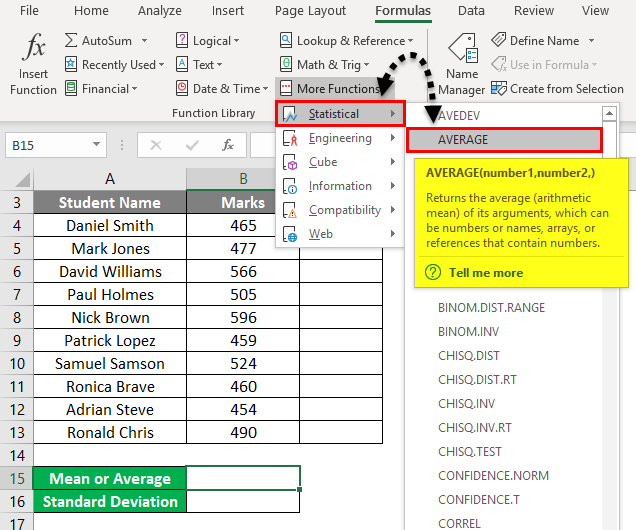
Step 2 – Click on the Statistical functions category from the drop-down list. It will again open a list of functions. Click on the AVERAGE function as shown below.
Step 3 – It will open a Function Arguments dialog box. Enter the Range from Cells B4:B13 under field Number1 and click on OK.
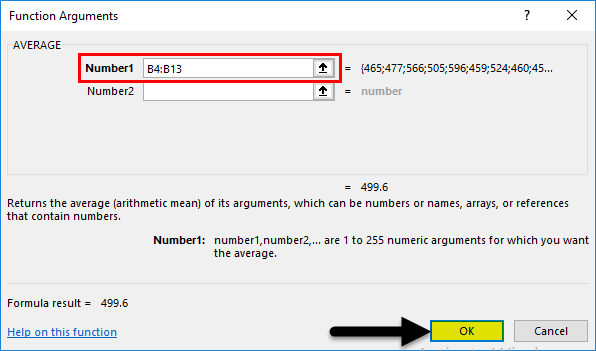
- It will give you the Average or Mean value.
Standard Deviation calculation:
To find the standard deviation, follow the below steps:
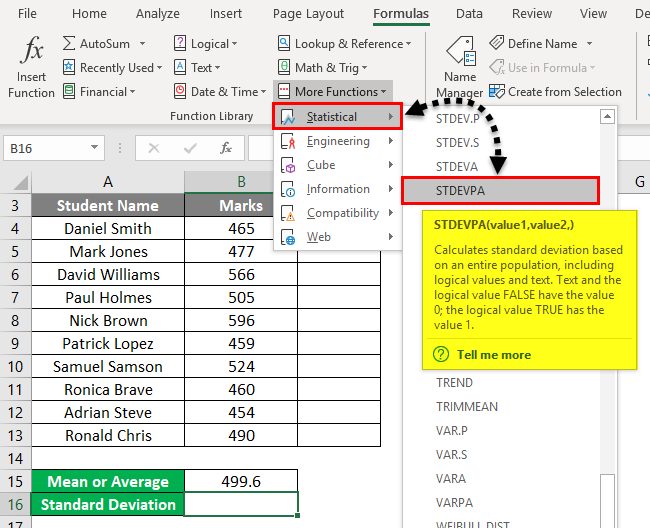
Step 1 – Go to the Formulas tab. Click on More Functions under the Function Library section.

Step 2 – Click on the Statistical Function category from the drop-down list. It will open a list of functions. Click on STDEVPA from the list, as shown in the below screenshot.
Step 3 – It will open a Function Arguments dialog box. Enter the cells range from B4:B13 under field Value1 and click on OK.
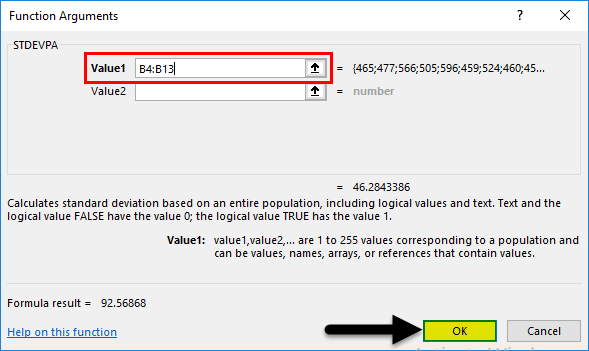
- It will give you the standard deviation value.
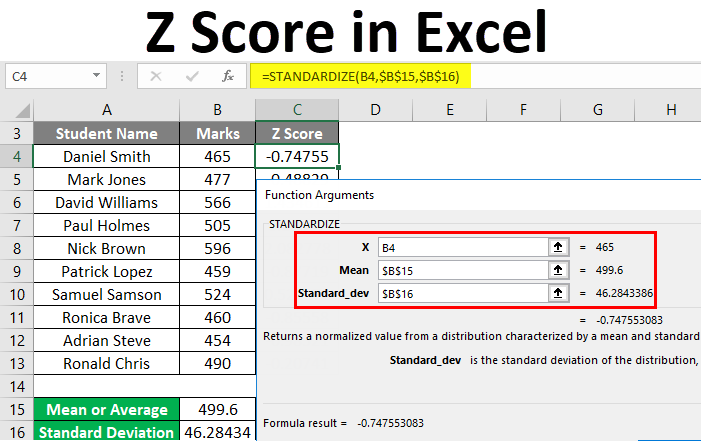
Now we have to calculate the Z score values in Excel. For this, follow the below screenshots:
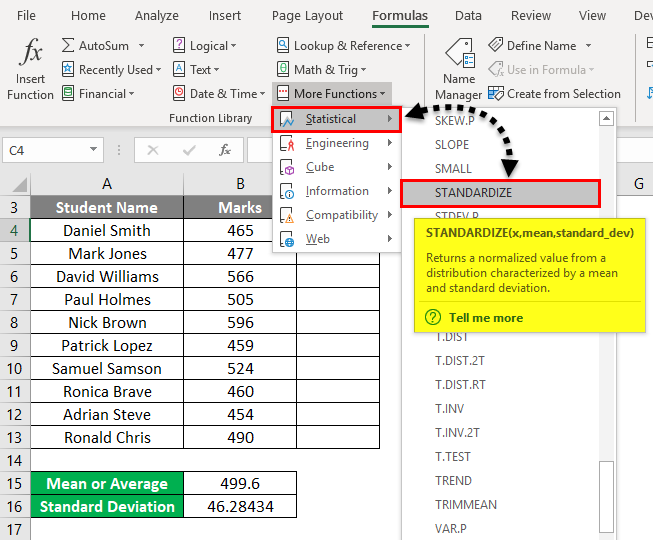
- Go to the FORMULAS tab. Click on the More Functions option under the Function Library section.

- Then a drop-down list of functions will open. Click on Statistical functions from the list. It will open a list of functions. Click on STANDARDIZE function from the list as per the below screenshot.
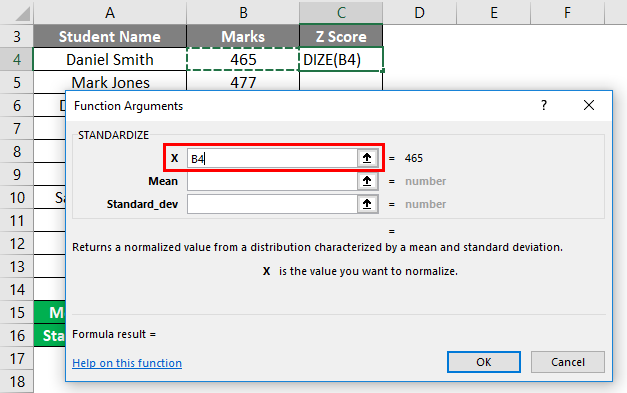
- Then it will open a Function Arguments dialog box. Enter the Cell value B4 under field X.
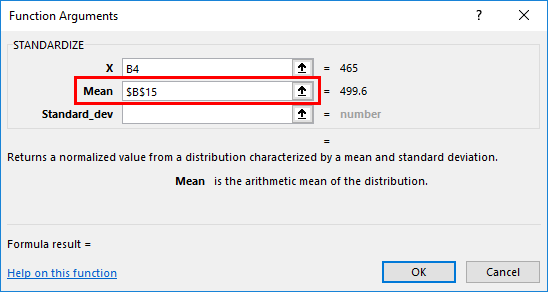
- Enter the Mean value in the second field, Mean, mentioned under Cell B15.
- Enter the Standard Deviation value in the third field, Standard_dev, mentioned under Cell B16. Click on OK.
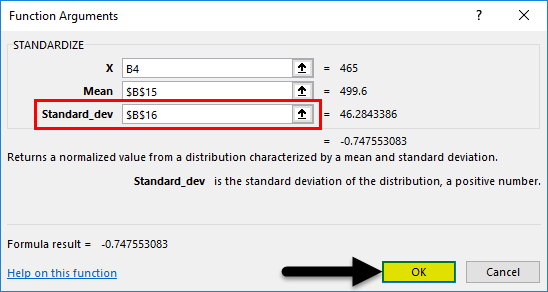
- The result will be as given below.
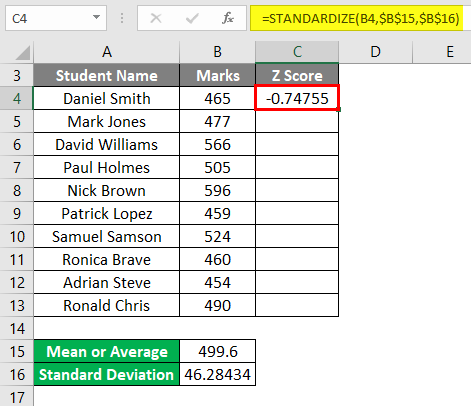
- Drag this formula for the rest values, and it will pop up the Z score values in Excel, as shown below:
Explanation
- If we analyze the data, the highest Z score value is 2.082778, the Z score value of Nick Brown, who has achieved the highest score in the exam.
- The smallest Z score value is -0.98521, the lowest Z score value of Adrian Steve, who has achieved the lowest score in the exam.
- There can be positive and negative values in Z scores.
- Students who have achieved scores more than the mean value get positive Z scores.
- Students who have achieved scores less than the mean value get negative Z scores.
- If the Z score is zero, the student’s score is the same as the mean value.
Excel Z Score – Example #2
We have given the below data values.
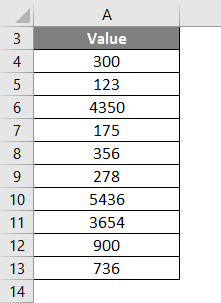
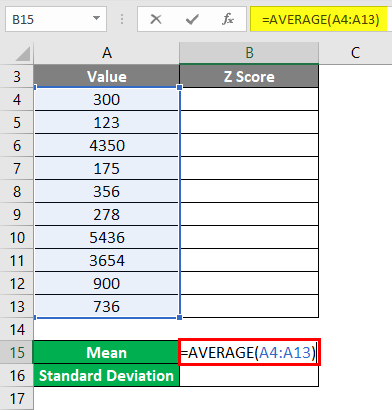
We need to determine the first mean and standard deviation in excel to calculate the Z score or standard score.
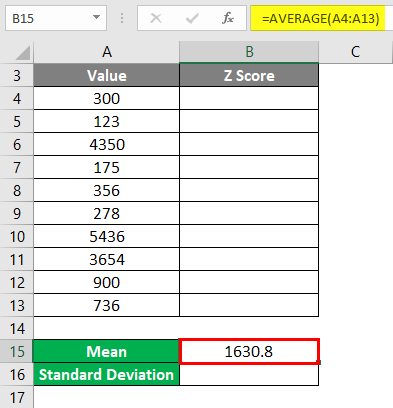
- Let’s apply the AVERAGE formula for calculating the mean of the given dataset.
- It will give you the Average or Mean value.
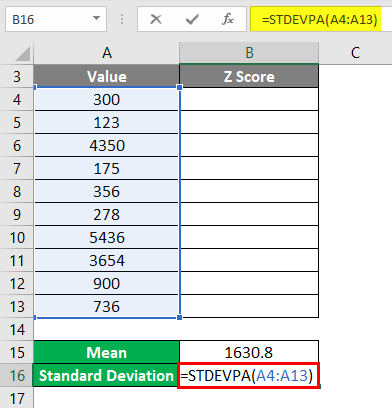
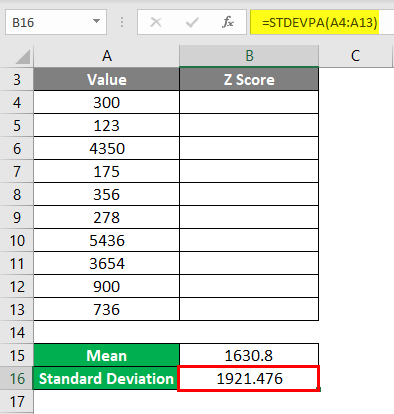
For calculating standard deviation, let’s apply the STDEVPA function for the given data values per the screenshot below.
- It will give you the standard deviation value.
- Now we will calculate Z score values in Excel. For this, apply the STANDARDIZE function for the given data values as per the below screenshot.
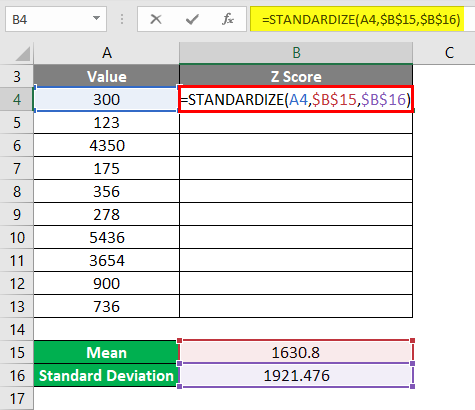
- The result will be as given below.
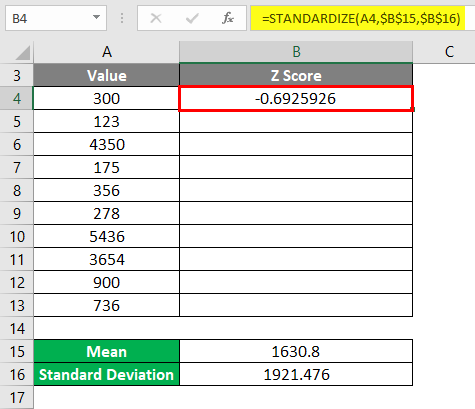
- Drag this formula for the rest values. The Final result is given below:
As we can see, the positive value of Z scores is higher than the mean value, and the negative value of Z scores is lower than the mean value.
Things to Remember
- The Z score tells us a number of standard deviations away from the distribution’s mean or dataset.
- The data values higher than the mean Z score will be positive.
- Data values that are below the mean Z score will be negative.
- The z-score value is probably used for statistical analysis.
Recommended Articles
This has been a guide to Z Score in Excel. Here we discuss how to calculate Z Score in excel, practical examples, and a downloadable Excel template. You can also go through our other suggested articles –
