Updated June 8, 2023
Correlation Matrix in Excel
Before moving towards the actual topic of the Correlation Matrix in Excel, I would like to explain what correlation is and where it can be used.
- As per English literature, the word Correlation means a mutual relationship or connection between two or more things. In statistical terms, we come up with situations where we are keen to check (or find out) if there is any relation/association between two (or more than two) variables. These are the things of interest while doing statistical analysis. In a nutshell, it can be said that correlation is a statistical analytical process that allows us to find out the relationship between two or more variables.
- Correlation can be measured through the correlation coefficient (denoted by “r”), a numeric measure to determine the association/mutual relation between two variables at a time. The correlation is considered perfect if the correlation coefficient’s numeric value is -1 or +1. However, it is almost impossible to find out the perfect correlation; if the value of the correlation coefficient is zero (0), then it is said that there is no correlation between the two variables under study. If the correlation value varies from -1 to +1, the correlation is weak, moderate, and strong based on the numeric value of the correlation coefficient.
- Correlation Matrix: The correlation matrix is a table that represents the values of correlation coefficients for different variables. It shows a numeric value of the correlation coefficient for all the possible combinations of the variables. It is used when determining the relationship between more than two variables. It consists of rows and columns containing variables, and each cell contains coefficient values that give information about the degree of association/linear relationship between two variables. Moreover, it can also be utilized in some statistical analysis. Ex. Multiple Linear Regression, where we have several independent variables and a correlation matrix, helps determine their degree of association.
All these basic things are enough. Let’s go out for some practice with the correlation matrix in Excel and see how we can construct a correlation matrix in Excel.
How to Enable Analysis ToolPak in Excel?
Excel has a powerful tool for doing all statistical analysis, using which we can do almost every sort of important analysis with just a few clicks. It is named Analysis ToolPak. You probably need to add it there if you cannot see it through your data analysis tab. Just follow the below simple steps.
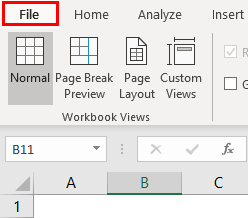
- In the Excel workbook, click File.
- Go to Options.

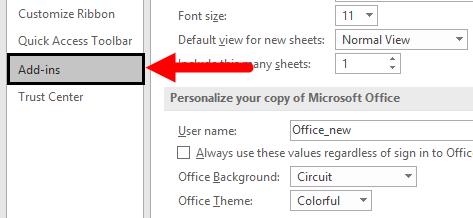
- Under Options, go to Add-ins,
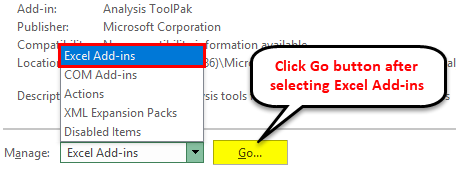
- A screen will pop up. Go to the Manage option, select Excel Add-ins, and click Go Button.
- Under Add-ins pop up, check Analysis ToolPak and click OK.
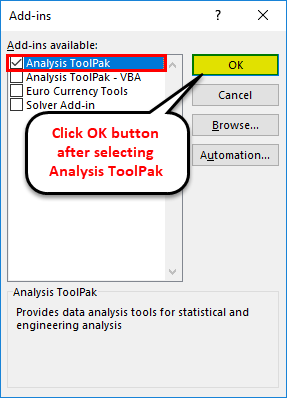
- Whoa, you have successfully enabled Analysis ToolPak in Excel.
Now you should be able to construct a correlation matrix for the given data set.
How to Create a Correlation Matrix in Excel?
Creating a correlation matrix in Excel is very simple and easy. Let’s use an example to understand the steps to create a correlation matrix in Excel.
Example of Correlation Matrix in Excel
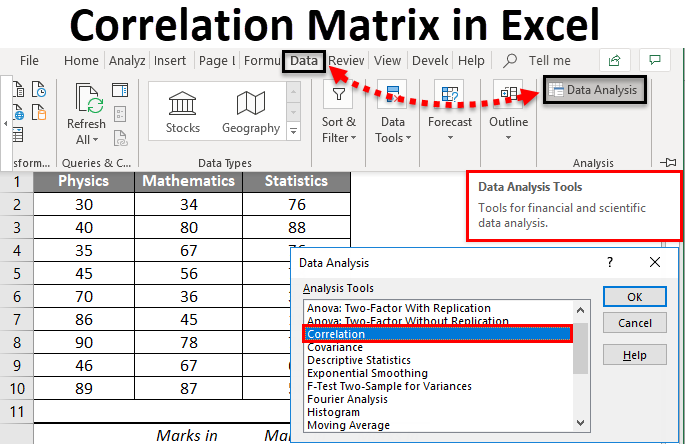
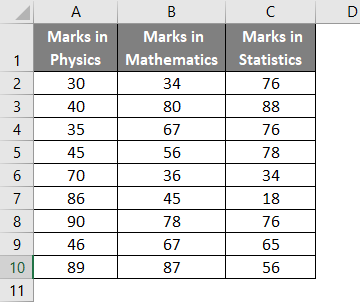
Suppose we have a data set containing annual marks in Physics, Mathematics, and Statistics. And we are keen on figuring out if there is any association/relationship between these three.
Let’s find it out through an Excel correlation matrix. Follow these steps.
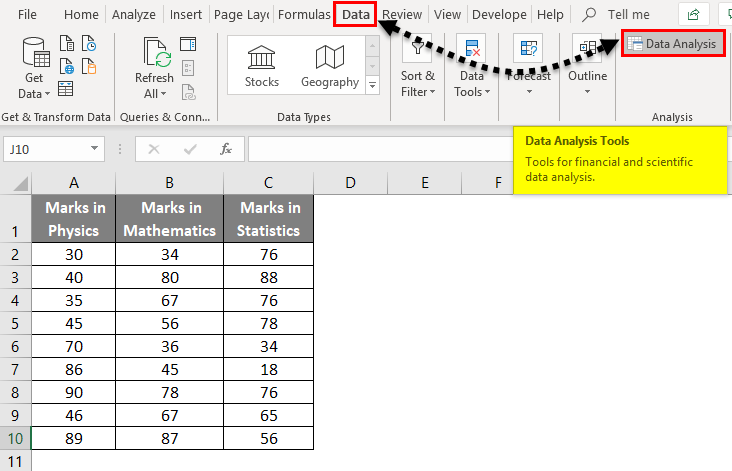
Step 1 – Go to the Data tab in your Excel workbook and click on Data Analysis.
Step 2 – Data Analysis window will appear. Select Correlation there and click OK.
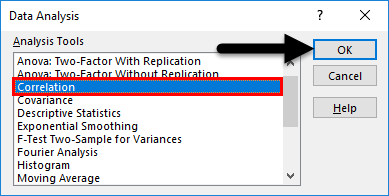
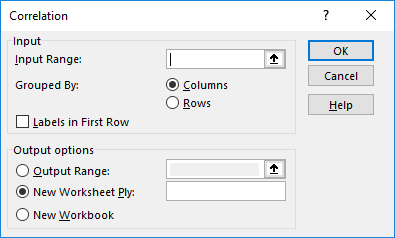
- A correlation window will appear.
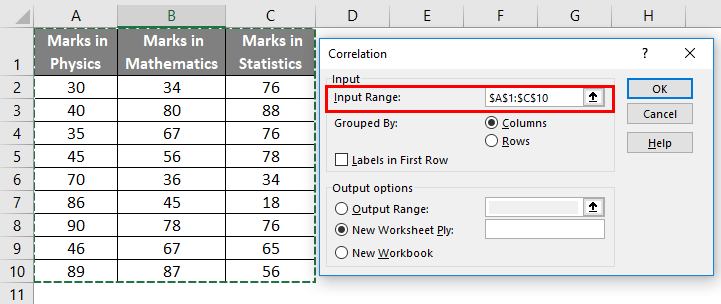
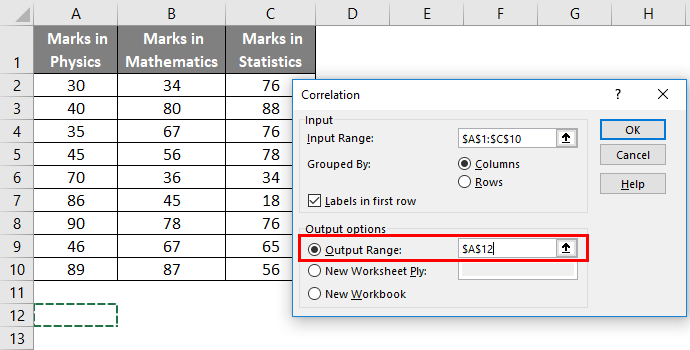
Step 3 – In the Correlation window that popped up, select the Input Range as your source data, including column headers (A1:C10 in this case).
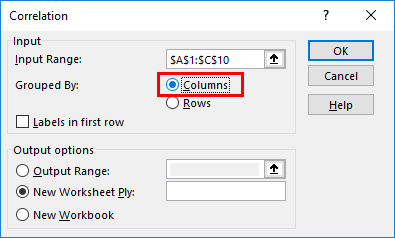
Step 4 – As columns group your data, click the Columns radio button.
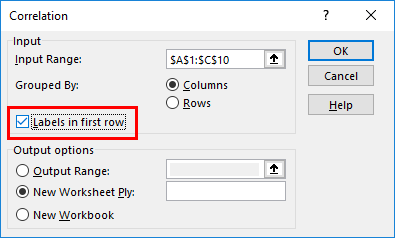
Step 5 – Under Grouped by, Labels in the first row should checked, as we have column headers stored under the first row for reference.
- Under Output options, you have three customizations available.
- If you want to store the result under the same worksheet where your source data is, click on the Output Range: radio button, and you should be able to give the output reference from the current worksheet.
- If you want to store the result in a new worksheet than your data source, click on New Worksheet Ply: radio button. It will store the output in a new Excel sheet under the same workbook.
- If you want to store the result in an entirely new workbook, select the New Workbook radio button. It will allow you to store the result under the new untitled workbook.
I referenced the sheet where my source data is (A12) in this example.
Step 6 – Click OK once done with customizations.
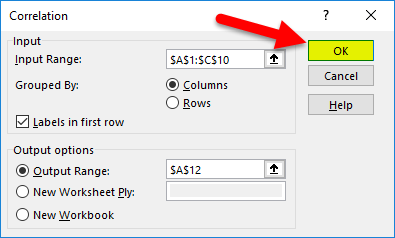
- So the output will be as given below.
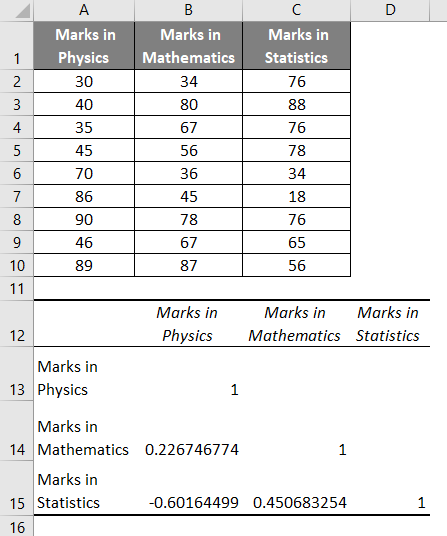
Let’s figure out our conclusions through the correlation matrix in Excel:
- The cells having value 1 are the cells associated with variables that correlate with themselves.
- 2267… shows that there is a positive correlation between Marks in Physics and Marks in Mathematics. However, it can be considered a weak positive correlation. It ideally shows the increase in Marks obtained in Physics leads 22.67% increase in Marks obtained in Mathematics.
- -0.6016… shows that there is a strong negative correlation between Marks in Physics and Marks in Statistics. It ideally shows the increase in Marks obtained in Physics leads 60.14% decrease in Marks obtained in Mathematics.
- 4506… shows that there is a positive correlation between Marks in Mathematics and Marks in Statistics. It ideally shows that the increase in Marks obtained in Mathematics leads to a 45.06% increase in Marks obtained in Mathematics.
Things to Remember About Correlation Matrix in Excel
- Constructing a correlation matrix in Excel makes sense when you have three or more three variables to check the association.
- Analysis ToolPak add-in is available in all versions of Excel but not automatically enabled. You need to enable it through the steps mentioned in the article above. That’s how you can construct a correlation matrix in Excel. I hope it helps you grow.
Recommended Articles
This has been a guide to Correlation Matrix in Excel. Here we discuss how to create a correlation matrix in Excel, an example, and a downloadable Excel template. You can also go through our other suggested articles –
