Updated July 3, 2023
Introduction to Standard Deviation in Excel
Standard Deviation in Excel is a statistical metric that determines how much the values in a range of cells deviate from the average or mean value.
For example, if the average score of students in a class is 80, with a standard deviation of 2, it means that the scores of most students will be within a range of 78 to 82. Most scores are close to the average, so the standard deviation will be small. But if some students score very high (for instance, 98 marks) or very low (for instance, 67 marks), the standard deviation will be bigger.
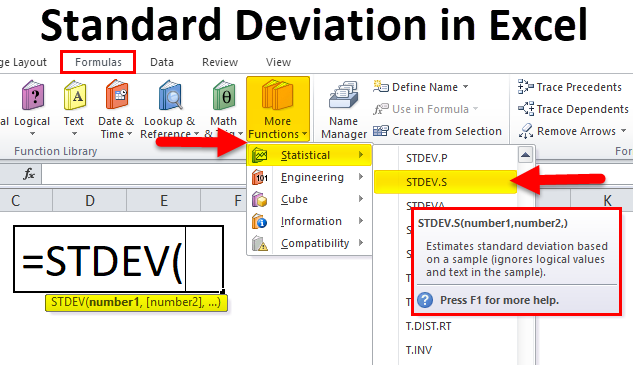
Excel provides three functions to calculate standard deviation, which include STDEV.P, STDEV.S, and STDEV (older version not recommended for use). You can use the STDEV.P function when you have information on everyone in the group (the entire population) or use the STDEV.S function when you only have information on a smaller part of the group (called a sample).
To understand standard deviation, you must understand these three scenarios:
- If the standard deviation is 0, it means that all the numbers in the data set are the same (this means that the average or mean is the same).
- If the standard deviation is high (a big number), it means that the numbers in the data set are very different from each other. This makes the average less helpful for understanding the data.
- If the standard deviation is close to 0, it means that the numbers in the data set are similar to each other. This makes the average more helpful for understanding the data.
Standard Deviation Formula in Excel
Standard Deviation Formula in Excel has the below-mentioned arguments:
- number1 (compulsory or mandatory argument): To use the formula, enter at least one number from your data set, called the “number1” argument.
- [number2] (optional argument): Using this argument, you can also add more numbers if you want, up to a maximum of 254.
Note:
- The second argument is unnecessary if you have already included all the numbers in the first argument’s range.
- The formula only works with numbers, references to cells with numbers, or arrays and ignores any text or logical values in the data.
If you type =std or =dstd in Excel 2019, you will see eight different types of standard deviation formulas.
These formulas are grouped into two categories: Sample and Population.
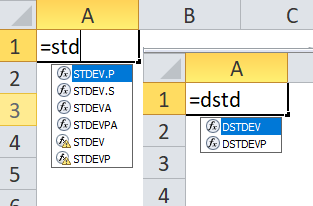
- Sample formulas include S, STDEVA, STDEV, and DSTDEV.
- Population formulas include STDEV.P, STDEVP, STDEVPA, and DSTDEVP.
The main difference between the sample and population is:
Population (STDEV.P): Where “P” stands for “Population”, it includes all the elements from a data set in Population (N).
Sample (STDEV.S): Where “S” stands for “Sample”, only a sample of the data set is considered from the entire data set (N-1).
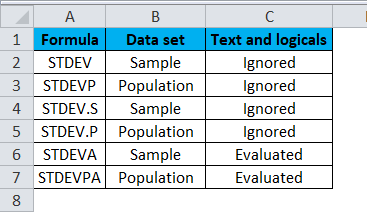
Deciding which standard deviation formula to use for a specific task depends on the type of data in the data set, such as whether it contains logical or text values.
The below-mentioned table can be helpful in determining which formula to use:
How to Use Standard Deviation in Excel?
Standard Deviation is simple and easy to use. Let’s understand the working using some examples.
Example #1
Sample Standard Deviation Calculation
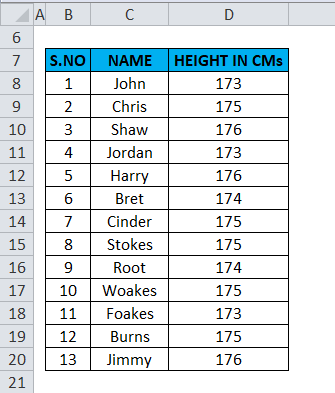
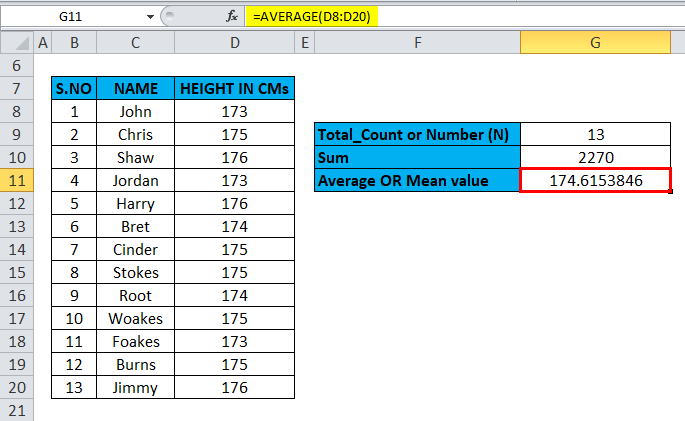
The below table contains three columns: Serial number in column B (B8 to B20), Name in column C (C8 to C20) & Height of person in column D (D8 to D20). We must find out the standard deviation of the Height of a person.
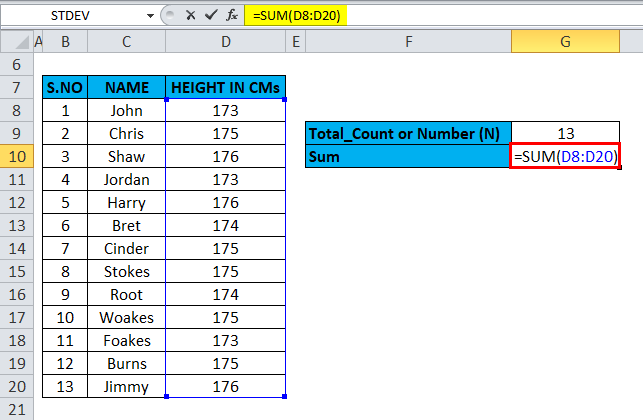
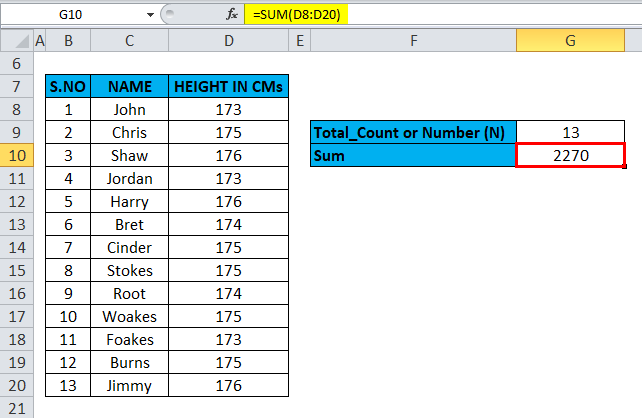
Before the calculation of standard deviation in Excel, we need to calculate the Sum & Mean (Average) values for the data sets.
The sum value is calculated with the help of the sum formula, i.e., =SUM (D8:D20) in cell G10.
The result is as follows:
The Mean (Average) is calculated with the help of the Average formula, i.e., =AVERAGE (D8:D20) in cell G11.
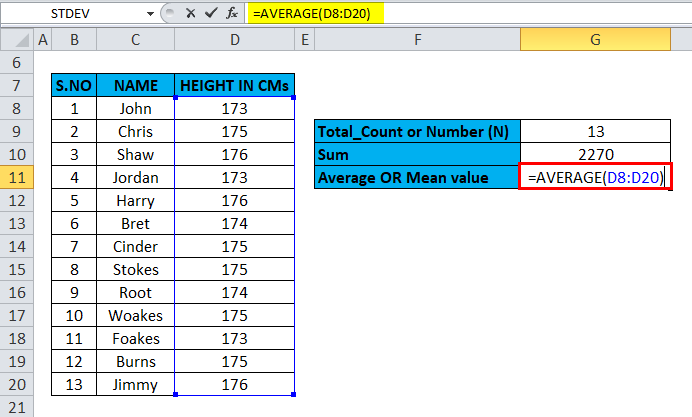
The result is as follows:
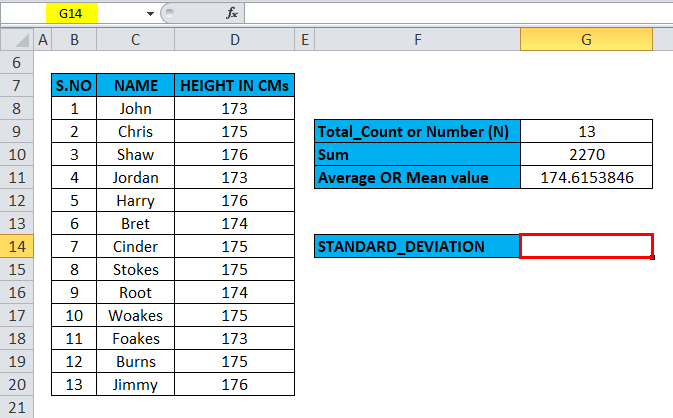
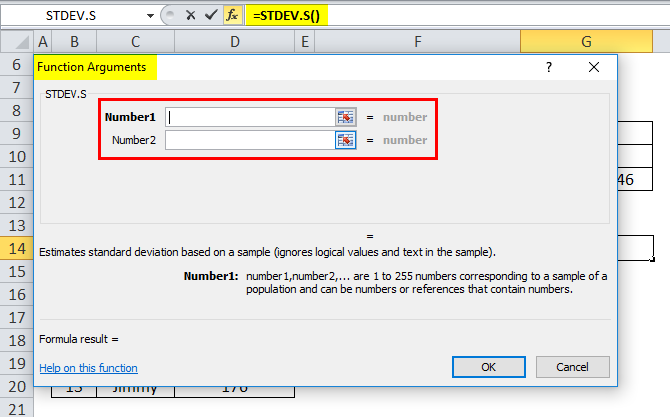
Let’s apply the standard deviation function in cell “G14”. For this, select the cell “G14”.
Click the insert function button (fx) under the formula toolbar. A dialog box will appear; type the keyword “Standard Deviation” in the “Search for a function” box. As a result, 6 types of Standard Deviation Formulas will appear in the “Select a function” box.
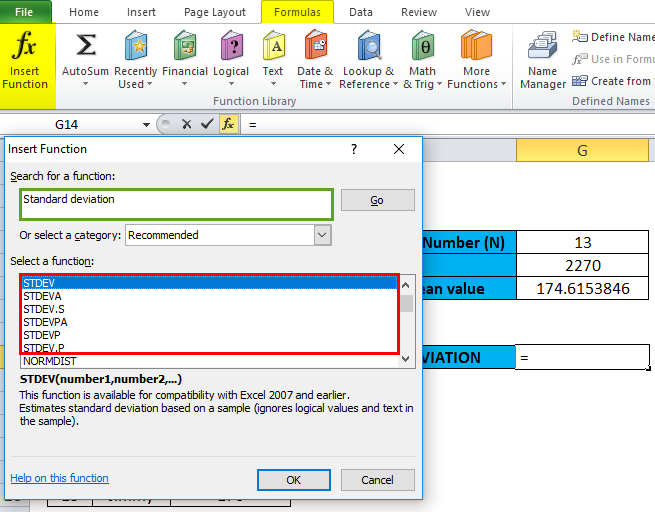
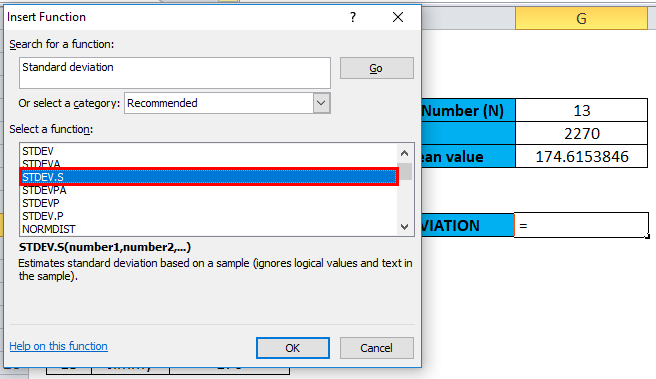
Here, we are calculating standard deviation only for the sample of the data set that is taken out from a large population. Therefore, we can select either STDEV.S or STDEV. Let’s use STDEV.S (for a sample) from the Statistical category by double-clicking on STDEV.S in Excel.
A dialog box appears where arguments for the standard deviation function need to be filled or entered, i.e., =STDEV.S (number1, [number2], …).
We want to insert formula =STDEV.S(D8:D20) since the height data is present in the range D8:D20.
To enter Number 1 argument: Click inside cell D8 and drag down until cell D20 is selected. This will select the entire range of data (D8:D20) for height.
Number 2 argument: Since we have already covered the entire sample data through the range selected in step 2, there is no need to enter a Number 2 argument. Click ‘OK’ after entering the standard deviation arguments.
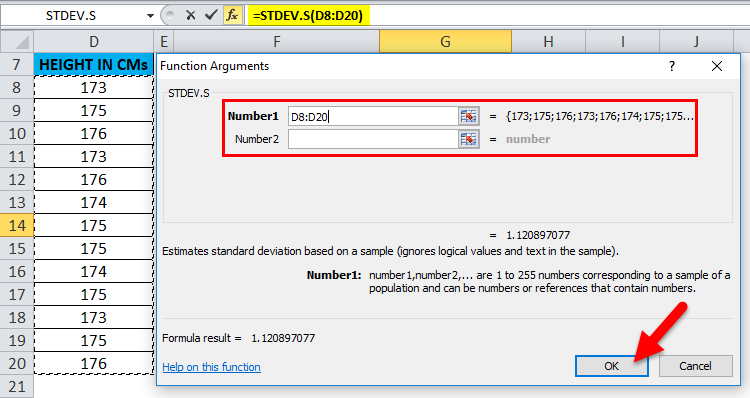
The result is a standard deviation value of 1.12.
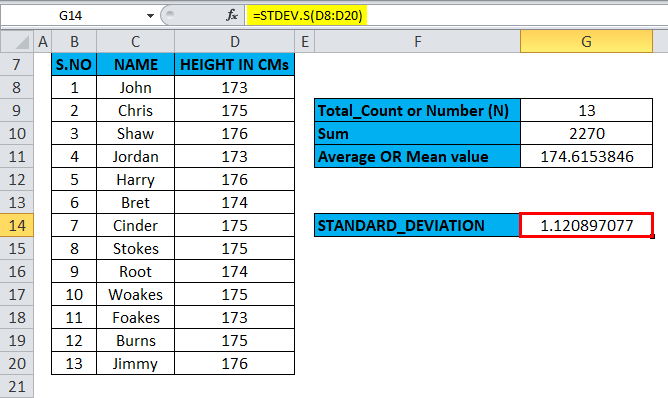
A standard deviation value of 1.12 indicates that most people in the group would have a height within the range of 174.61 cm (with a standard deviation of +1.12 or -1.12).
Since the standard deviation is close to zero here, it indicates that the data set has a relatively low degree of variability in terms of height.
Points to note about STDEV.S function in Excel
- It can serve as a worksheet function and can also be applied by using VBA code.
- Investors commonly use it to measure the risk of a stock (a measure of stock volatility over a period of time).
- Financial analysts often utilize it for measuring and managing risks for a specific portfolio or fund.
- Moreover, it is used in election polls and surveys to measure variation in public responses.
- It is used in weather prediction to measure deviation from normal numbers.
Example #2
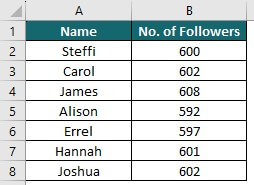
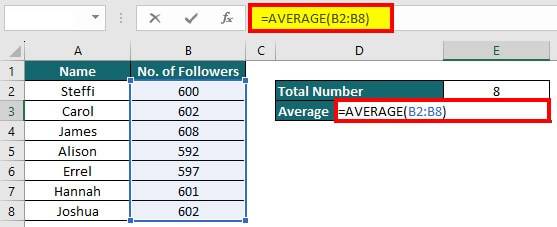
Let’s say the below individuals started their Instagram account on January 1st, and by January 31st, they had gained the corresponding number of followers. We want to calculate the standard deviation of their follower growth.
Solution:
Now, we calculate the average using the formula =AVERAGE(B2:B8).
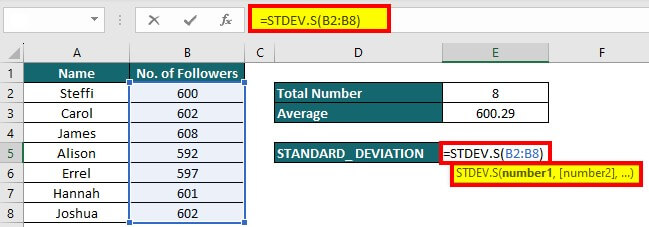
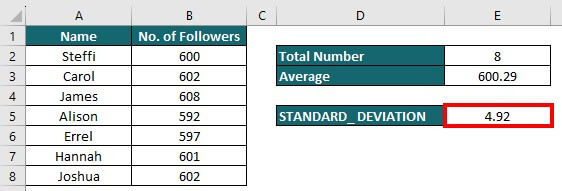
We apply the formula =STDEV.S(B2:B8) in cell E7 to calculate the standard deviation.
The standard deviation is 4.92. This shows that people have varying rates of gaining followers. Some individuals have gained followers much faster or slower than the average.
Example #3
Population Standard Deviation Calculation
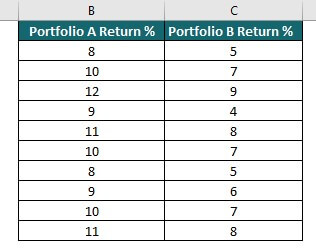
Suppose a financial analyst at a large corporation wants to analyze the returns of two different investment portfolios over the past year. The analyst wants to calculate the standard deviation of the returns for each portfolio to determine which one is less risky.
Solution:
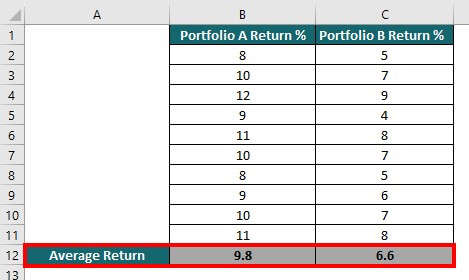
The below table shows the percentage of return on Portfolios A & B, respectively.
We calculate the average of Portfolio A by using the formula =AVERAGE(B2:B11).
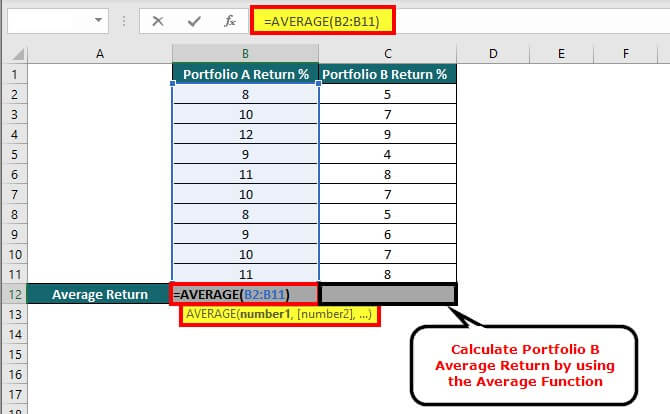
Similarly, we calculate the average of Portfolio B by using the formula =AVERAGE(C2:C11).
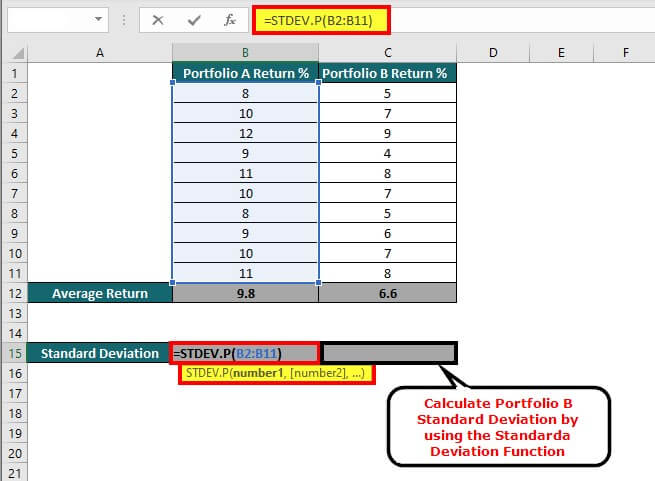
Thereafter, we use the formula =STDEV.P(B2.B11) to calculate the standard deviation.
As a result, we obtain the standard deviation results for both portfolios.
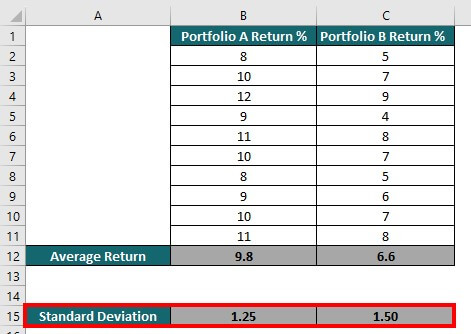
The table shows that the standard deviation of the returns for portfolio A is 1.25%, while the standard deviation for portfolio B is 1.50%. This suggests that Portfolio A is less risky than Portfolio B due to a lower standard deviation. In other words, the returns of portfolio A are more consistent over the past year, whereas the returns of portfolio B are more volatile.
Real-World Applications
|
Application of Standard Deviation |
Example |
| Risk Analysis | Suppose an investor is deciding between two stocks to invest in. Stock A has a standard deviation of 8%, while Stock B has a standard deviation of 15%. The investor can use this information to see that Stock B is riskier than Stock A. As a result, they may choose to invest in Stock A to lower their risk exposure. |
| Academic Performance | A teacher finds that the standard deviation of test scores for a class of 60 students is 12 points. This means that there is significant variability in the scores. This may need further investigation to understand why some students perform better or worse than others. |
| Climate Science | A climate scientist is studying the standard deviation of annual temperatures in a specific region over the past 50 years. The scientist finds that the standard deviation is 2 degrees Celsius, indicating significant variability in the temperatures from year to year. As a result, this information can help predict future temperature patterns and guide climate policy decisions. |
| Sports Performance | A coach analyzes the standard deviation of how many times their team completes a particular drill during practice. They find that the standard deviation is 1.5 seconds, indicating a significant range of completion times among the team. Thus, the information can be used to identify which players need more training to improve their performance. |
| Market Research | Suppose a business conducts a survey to measure customer satisfaction with a product. After analyzing the responses, the company discovers that the standard deviation of the ratings is 2 on a scale of 1-10. This suggests that there is a significant range of opinions among customers. Therefore, the business can investigate why some customers are more satisfied than others. |
Advantages and Disadvantages of Standard Deviation in Excel
Advantages
- Risk analysis: Standard deviation is also used to calculate risk. Investors can determine the degree of risk associated with a stock or portfolio by analyzing the standard deviation of the returns.
- Forecasting: Standard deviation can help create forecasts in Excel. For instance, if a company wants to forecast sales for the next quarter, it may employ historical data and the standard deviation to calculate a range of possible outcomes and make predictions about its future sales.
- Population Mean: Standard deviation can estimate a population mean when the population mean is unknown. One can achieve this by simply calculating the sample mean and then calculating the standard deviation of the sample.
- Quality control: Standard deviation is a helpful tool for detecting variations in data. One can monitor and control quality in Excel by tracking changes in the standard deviation of a process over time.
- Measure Volatility: Standard deviation can help measure the volatility of a financial instrument or portfolio of investments. It provides a measure of how significantly the returns are dispersed from the mean return.
Disadvantages
- Standard deviation is sensitive to outliers (big or small numbers in the group) and can be distorted by these extreme values.
- It is not the best measure of dispersion when the data is abnormally distributed.
- Standard deviation simply indicates the variation amount, not the variation’s direction.
- It may not always be easy to interpret, especially for non-statisticians.
- Additionally, the standard deviation can be affected by small sample sizes.
Things to Remember
- While working with a smaller set of data, using the S formula to calculate the standard deviation is recommended. This is because we want a more accurate estimate of the true standard deviation of the whole data set, and the S formula considers that we are working with a smaller sample.
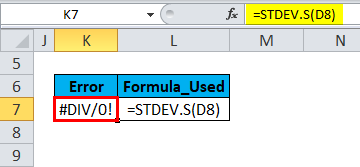
- To calculate Standard Deviation in Excel, the number argument must contain at least two or more numeric values. If there are less than two numeric values in the number argument, then we won’t be able to calculate standard deviation at all. Excel will show an error message: #DIV/0!
- #VALUE error occurs if any of the given values in the number argument are text values in S and STDEV.P. (Note: If the Standard Deviation function is not able to interpret text value as a numeric value, then #VALUE error will occur)
- S & STDEV.P function can be applied to multiple ranges or groups.
Frequently Asked Questions (FAQs)
Q1. How to calculate Standard Deviation in Excel?
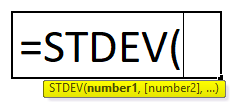
Answer: Use the STDEV function to calculate standard deviation in Excel. To use this function, you can enter the data points as arguments separated by commas or reference a range of cells that contains the data points. The syntax of the function is:
STDEV(number1, [number2], …)
For example, if you have a set of numbers in cells D1 to D15, you can type the formula “=STDEV(D1:D15)” in any cell to calculate the Standard Deviation.
Q2. What is the difference between STDEV.S and STDEV.P functions in Excel?
Answer: The STDEV.S function calculates the standard deviation of a sample data set, whereas the STDEV.P function calculates the standard deviation of a population.
For instance, if you have sample data of 20 students’ test scores, you can use the STDEV.S function. However, if you have sample data of students’ test scores in a particular district, you can use the STDEV.P function.
Q3. How can I interpret the Standard Deviation value in Excel?
Answer: In Excel, the standard deviation number tells us how much the data points in a collection deviate from the mean or average value. When the standard deviation is higher, the data points are more dispersed. In contrast, when the standard deviation is lower, it indicates that the data points are more closely clustered around the mean.
Recommended Articles
This is our guide to Standard Deviation in Excel. Here are some further articles for expanding understanding:
