Updated April 25, 2023
What is SPSS?
SPSS is a Software widely used as a Statistical Analytic Tool in the Field of Social Science, Such as Market research, Surveys, Competitor Analysis, and others. It is a comprehensive and flexible statistical analysis and data management tool. It is one of the most popular statistical packages that can easily manipulate and analyze highly complex data. It is designed for both interactive and non-interactive users.
Functionalities of SPSS
Some of the functionalities of SPSS include the following:
- Data transformations
- Data examination
- Descriptive statistics
- General linear model
- Reliability tests
- Correlation
- T-tests
- ANOVA
- MANOVA
- Regressions
- Factor analysis
- Cluster analysis
- Probit analysis
- Time series
- Survival analysis
- Graphics and graphical interface
It consists of 2 Sheets – The Data View and the Variable View.
Features
- It is easy for you to learn and use.
- It includes a lot of data management systems and editing tools.
- It offers you in-depth statistical capabilities.
- It provides excellent plotting, reporting, and presentation features.
Benefits
Here are a few key points why it is considered the best tool to use:
- Effective data management: SPSS in data analysis easier and quicker for you as the program knows the location of the cases and the variables. It reduces the manual work of the user to a great extent.
- Wide range of options: It offers various methods, graphs, and charts. It also comes with a better screening and cleaning option of the information to prepare for further analysis.
- Wide range of options: The output is kept separate from the data. It stores the data in a separate file.
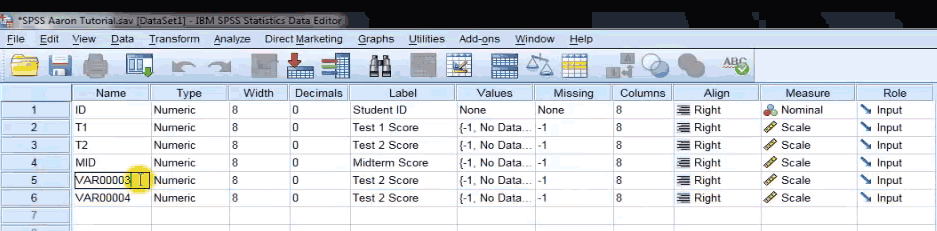
Variable View
It is the sheet where you define the Variable of the Data that you have; The Variable View Consists of the Following Column heading,
- Name: Enter the Unique Identifiable and Sorting Variable Name, Eg: In the Data of Students, The Variables can be ID, Sex, Age, Class, Etc; note: This will not allow any special character or Space while describing the variables of the Data, and Once you enter the First Variable, Immediately you can see SPSS generating all the other information regarding how you want to set that Variable that you have entered to be.
- Type: You Can Change the Type of Variable, Whether Numeric, Alphabet, or Alpha Numeric, by selecting the respective Type in this column; this will restrict the use of any other type under this variable column.
- Width: Defines the Character Width this Variable Should allow; especially helpful while entering a Mobile number, which allows only 10 characters.
- Decimal: Defines the Decimal point you must display, Eg: Used in case of percentages.
- Label: Since the Name Column Doesn’t allow you to use any Special Character or Space, here you can give any name as a Label for that Variable you wanted to assign.
- Value: This is to define/ Label a Value Wherever you see it in the Data, Eg: You can Label “0” in the data as ABSENT for Exam, So when you find 0 in the data, it will be labeled as ABSENT for Exam, You Can also Label the Employee ID Number with their Name So that Using the value Label Switch Button you can view the Name of the employee, but in the report, the Name will not appear, only the EMP ID number will appear, This helps in reading the data better in the data view.
- Missing: You can mention the Data which you don’t want the SPSS to consider while analyzing, Like “0” Value is considered Absent, so for analysis, it will neglect “0” if it’s mentioned in Missing, which will be helpful in Mean, Mode Etc.
- Align: You can mention the alignment of the data in the datasheet, Left, Right or Middle.
- Measure: This is where you will define the measure of the variable you have entered, Whether Scale, Ordinal, or Nominal Type of Variable.
After defining all the variables of the data, Once you click on the DATA View Sheet, You can See the Labels entered by you as the Columns Label.
Data View
The Data View is a Spreadsheet that contains rows and columns; the Data Can be entered in the Data View Sheet Either Manually or the data can be imported from the data file; it can read the data file in any of the formats, which can be Excel, Plain text files or relational (SQL) Databases, Before importing the excel sheet change the excel file format to (.xls)
Importing Excel Data File into SPSS
- Click File …. Select Open ….. Select Data
- In the Dialog Box, in Files of Type DropBox, Select .xls File.
- Then select the Excel file data stored in your system and select Open.
- In the Dialog box, tick the “ Read Variable names from the first row of data.”
- Click Ok
- SPSS data Editor will open, and you can find your data file in it;
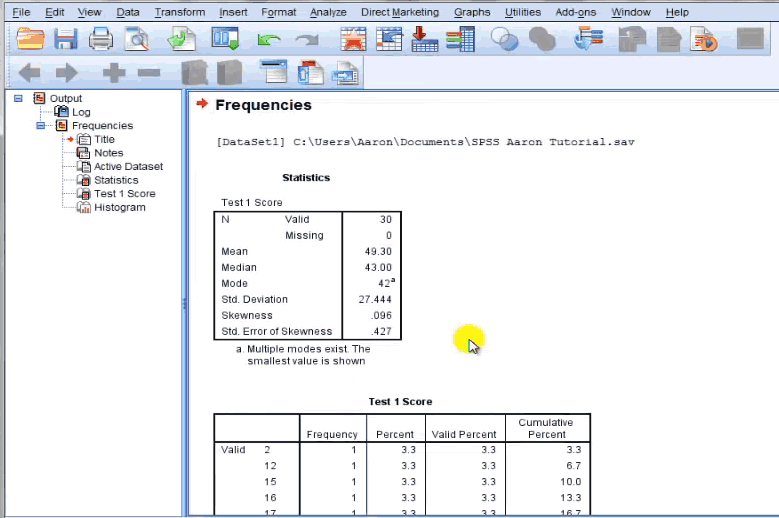
Analyze: After the data is imported or entered in the data view sheet, you can run the reports and analyze the data using the Analyze option on Top Toolbar; you can find All the Analytical tools in this option; let Us take that we have to find the Mean, Median, Mode for the data that is entered,
- Go to Analyze option.
- Select Descriptive Statistics.
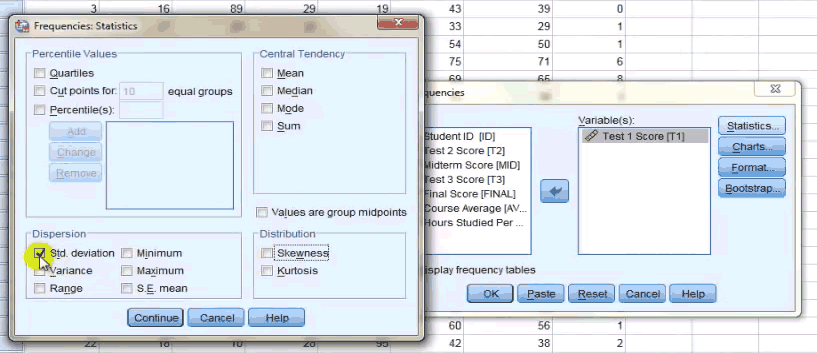
- Select Frequencies.
- In the Dialog Box, on the Left Side, You will Have a List of Variables That you have mentioned in the data; select the Variables for which you have to find the Mean, Median, and Mode and drop them in the right side box, using the drop button in the center.
- Click on the Statistics Button.
- You will find the Check box of Mean, Median, and Mode in the central tendency Dialog Box; check them.
- Click Continue.
- In the Frequencies Dialog Box, Click the Chart Button, and select the Type of Chart you want the data to be shown,
- Then click ok.
- The output will be opened in a separate window, with a List of Mean, Median, and Mode and a pictorial representation of the chart you selected earlier.
Statistical Test Using SPSS
Following is a statistical test using SPSS:
Quick Data Check
Before using any statistical test, It’s always advisable to do a data check to know how the data has been distributed and clearly defined, whether the missing values are neglected, etc.; Data Check is usually done using Charts so that any abnormalities can be easily detected and data can be corrected,
Histogram – is widely used to check the data in case of One Variable Tests – Creating a histogram is already explained;
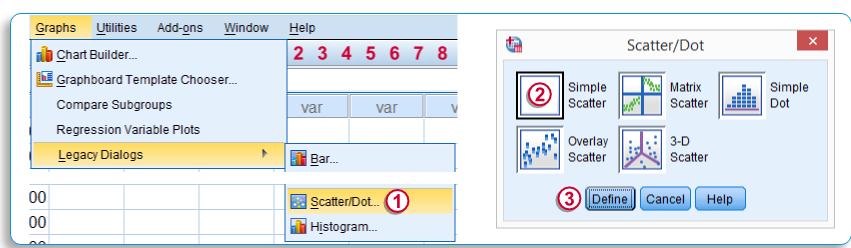
Scatter Plot Chart – is used for Two-Variable Tests:
- Click Graphs……… Select Legacy Dialogs…….. Select Scatter/Dot.
- Select the Simple Scatter Chart.
- Click define.
- You will find the X-axis and Y-axis for Comparison.
- Drop the Variable for X-axis and Y-axis, respectively.
- Click Ok.
Majorly Tests can be diversified based on the purpose, and it can be 2 Types – Comparison Tests and Association Tests; Comparison Tests can be further divided into 3 types based on the number of variables you want to compare, one variable tests, two variable tests, and multivariable test.
Comparison Tests – One Variable Using SPSS
Following are the comparison tests:
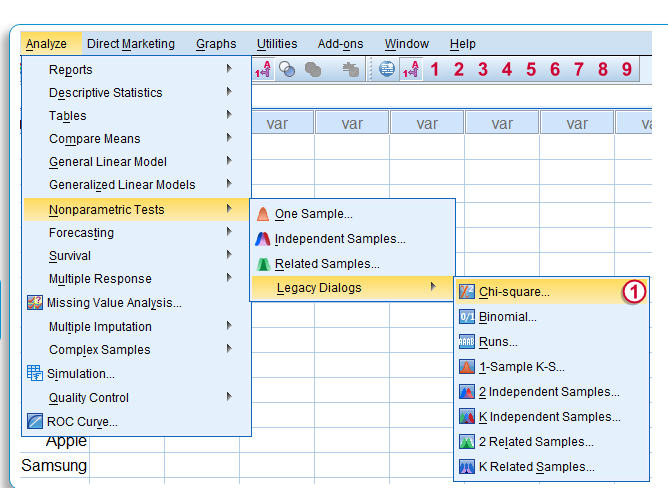
A. Chi-Square Test
- Click Analyze…. Select Non-Parametric Tests… Select Legacy Dialogs.
- Select Chi-Square Test.
- In the Chi-Square Dialog Box, Drop the Variable that you want to run the test in the “Test Variable List” using the Drop Button in the center.
- In Expected Range, Tick “ Get from Data.”
- In Expected Values, Tick “ All Categories Equal.”
- Click OK.
- The chi-Square result will appear in the Output Window.
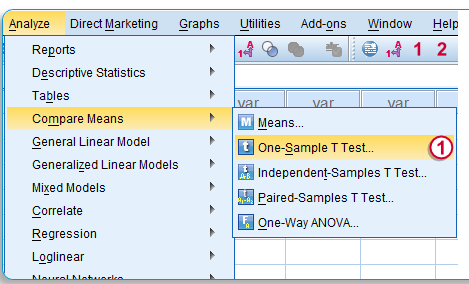
B. One Sample T-Test
- Click Analyze…. Select Compare Means…
- Select One Sample T – Test
- In the One-Sample T-Test Dialog Box, Drop the Variable that you want to run the test in the “Test Variable List” using the Drop Button in the center.
- In the test, the Value enters the Population value.
- Click Paste – Syntax will appear with all the conditions
- Click OK and run the Test
- One Sample T – Test result will appear in the Output Window.
Comparison Tests – Two-Variable Using SPSS
Following are the comparison tests:
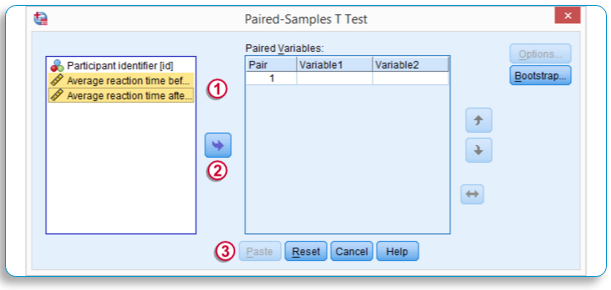
C. Paired Sample T-test
- Click Analyze…. Select Compare Means…
- Select One Paired Sample T-Test.
- In the One-Sample T-Test Dialog Box, Drop the Two Variables that you want to run the test in the “Paired Variable List” using the Drop Button in the center one by one.
- Click Paste – Syntax will appear with all the conditions.
- Click OK and run the test.
- Paired Sample T-Test result will appear in the Output Window.
Comparison Tests – More Variable Using SPSS
Following are the comparison tests:
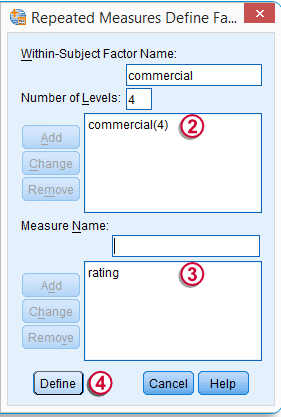
D. Repeated Measures ANOVA
- Click Analyze…. Select General Linear Mode
- Select Repeated Measures.
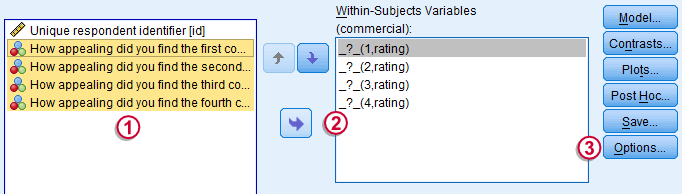
- In the Repeated Measures define Factor Dialog Box, we are going to explain the multiple variables that we are going to run.
- Give a Name to the Set of Variables that you will compare (Factor Name) – Like Courses, in the “Within-Subject Factor Name.”
- Enter the number of variables under this Factor in the “ Number of Levels.”
- Click ADD.
- Give the Measure Name, Like Rank, Rating,
- Click ADD.
- Click “Define” to Define the Variables under the Mentioned Factor Name – Courses.
- Drop all the Variables you wanted to include below the Factor Name ( Courses) to Within – Subject Variables
- Click the option and select Descriptive Statistics.
- Click Paste – Syntax will appear with all the conditions.
- Click OK and run the test.
- Repeated Measures ANOVA – The test results will appear in the Output Window.
Associate Tests – Two Variables
Following are the associate tests:
A. Correlation Tests
- Click Analyze…. Select Correlate…
- Select Bivariate…
- In the Bivariate Correlation Dialog Box, Drop the Two Variables that you want to run the test in the “Variable List” using the Drop Button in the center one by one.
- Ensure You tick “Pearson” Correlation Coefficients.
- Test of Significance tick “Two-Tailed.”
- Also, Tick Flag Significant Correlations.
- Click Paste – Syntax will appear with all the conditions.
- Click OK and run the test.
- Bivariate Correlation – The test result will appear in the Output Window.
B. One-Way Anova Test
- Click Analyze…. Select Compare Means.
- Select One Way Anova.
- In the One Way Anova Dialog Box, Drop the Variables in the Dependent List and the List of variables in the Factor List, for example, the Weight of Children in the dependent List and the Health Drinks in the Factor List.
- Select Option and Select Descriptive
- Click Paste – Syntax will appear with all the conditions
- Click OK and run the Test
- One Way Anova – test result will appear in the Output Window
SPSS Output Window
This Window Contains all the output which is run after the Statistical Tests; the output of the Statistical Test will be displayed in the Output window in the Table and Chart/graph format only;
The Output Window consists of 2 Segment – left-hand side; you can see the output outline, and on the right-hand side is the Actual Output; output Outline will show the Titles, and the subtitles of the output organized in a hierarchy tree structure, by clicking the title or the subtitles you can view the actual output; You can hide or delete the branch of the tree structure,
You can easily copy and paste the table into a Word or Excel sheet and copy and paste the graph or chart displayed in the actual output.
The Data Editor Window will be saved in (.sav) format as SPSS dataFile, the SPSS Syntax file will be kept in (.spv) format as an SPSS Syntax file, and the Output Viewer Window will be held in (.spv) or (.spo) format as an SPSS Output File.
How to Open the Saved SPSS File and Run the Output Again?
- Click File …. Select Open ….. Select Data.
- In the Dialog Box, in Files of Type DropBox, Select (.sav) File.
- Then select the SPSS data file you have stored in your system and Select Open.
- Click Ok.
- SPSS data Editor will open, and you can find your data file.
- Make the necessary changes if you want to edit the data or the Variables and run the test required.
The bottom line is though Excel offers a good way of data organization, it is more suitable for in-depth data analysis.
If you wish to learn about this in detail, try our online training on SPSS – Analyze Data for Statistical Analysis.
Recommended Articles
This has been a guide to What is SPSS and How Does It Work? Here we discuss the basic concept with functionalities, features, benefits, and different forms of tests in SPSS. You can also go through our other suggested articles to learn more –
