Updated March 18, 2023
OLAP – Definition
OLAP is online analytical processing as the name itself indication indicates the data analytic purpose; hence it enables us to analyze information from multiple database systems at the same time simultaneously. We can tell that it is a computing method that allows users to easily extract required data and query data in order to analyze it from different points of view. It is basically based on the huge data that is called a data warehouse; it collects the required data from the data warehouse and performs the business required analysis to take some decisions in the business to improve profit, sales, brand, and marketing, and so all. Therefore, it uses in business intelligence to aid in trends analysis, sales forecasting, financial reporting, planning purposes, budgeting, and so on.
What is OLAP?
The OLAP is OLAP (Online Analytical Processing) is a powerful technology behind many Business Intelligence (BI) applications that discovers data, report viewing capabilities, complex analytical calculations, and predictive “what if” scenario, budget planning, and forecast planning.
For example, a user can request that data be analyzed to display a spreadsheet showing all the movie’s releases in Mumbai in August, compare revenue figures with those for the same movie in December, and then see a comparison of other movies to check whether achieved higher success and become a profitable or not, in the same period. So by this analysis, will be able to make the decision about where the movie should be released and by which they get more profit and even this kind of data analysis help to plan marketing strategy like where to do marketing, how to do, through which channel to do and so on.
Now we will see how OLAP works – The data is first collected from multiple data sources (like a spreadsheet, video, XML, etc.) and stored in data warehouses, which are then cleaned and organized into data cubes. The term cube uses cube because it is categorized by three dimensions that multi-dimensions can even categorize. So each cube contains data categorized by some dimensions (such as customers, period, geographic sales region, and product) derived from multidimensional tables in the data warehouses. The dimensions can be populated by members or for dimensions that can take the value such as customer names, countries, and months that are organized hierarchically and want to analyze the specific values. The OLAP cubes are pre-summarized on the frequent queries across dimensions which improve q, improving time over relational databases. So like this, it works to facilitate a different kind of analysis within a time.
Like OLAP, the other term we are having is OLTP which is online transactional processing; both are online processing systems; the OLTP is transactional processing mainly concerned task on the transaction task, while OLAP is an analytical processing system that is mainly concerned with the analysis and reporting and gives them valuable insight to improve the business.
The OLAP makes working so easy in business reporting for sales, management reporting, marketing, business process management, financial reporting, budgeting and forecasting, and more.
It can be used to perform five types of analytical operations against multidimensional databases:
- Roll-up: Also known as drill-up or consolidation, used to summarize operation data along with the dimension.
- Drill-down: To perform the analysis deeper among the dimensions of data. For example, drilling down from “time period” to “years” and “months” and to “days” and so on to plot sales growth for a product.
- Slice: To perform the analysis, take one level of information for display, such as “sales in 2019.”
- Dice: To perform the analysis to select data from multiple dimensions to analyze, such as “sales of green apple in Bangalore in 2019.”
- Pivot: To perform the analysis that can gain a new view of data by rotating the data axes of the cube.
As the OLAP gives the cube which is of dimensions then find the intersection of dimensions, for example, all movie is profitable in Mumbai during a particular time period and displays the result. Each OLAP cube covers hundreds of measures with at least one possible, which are derived from information stored in the data warehouse’s fact tables.
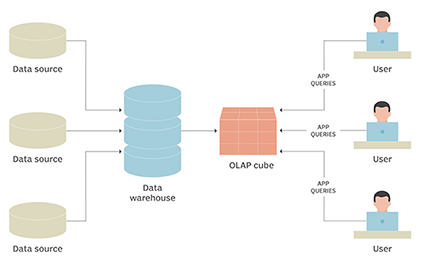
As in the figure, It starts working by data collection from multiple sources and stored in a data warehouse. Further, the OLAP cubes are created on cleansed data of the warehouse, against which users can run the queries.
There are basically three types of OLAP (Online Analysis processing):
- MOLAP (Multidimensional OLAP): MOLAP is an OLAP for multidimensional database indexes based.
- ROLAP (Relational OLAP ): ROLAP is an OLAP that performs dynamic multidimensional analysis on a relational database stored data.
- HOLAP (Hybrid OLAP ): HOLAP is a various integration of ROLAP and MOLAP. It is used to develop ROLAP data capacity with MOLAP, the superior processing capability to fulfill the processing requirements.
Advantages and Disadvantages of OLAP
Given below are the advantages and disadvantages mentioned:
Advantages:
- It can be used for data extraction or mining, analysis, and reporting to find the relationships between data items.
- We can use ODBC (Open Database Connectivity) to import data from an existing relational to create an OLAP multidimensional database.
- All transactional data is not required for trend analysis, so an OLAP database does not need to be as large as a data warehouse.
Disadvantage:
- Some of the disadvantages of OLAP are pre-modeling, which is a must, great dependence on IT, poor computation capability, slow in reacting, short of Interactive analysis ability, abstract model, and great potential risk.
Some of the analytic tools (OLAP) are IBM Cognos, Micro Strategy, Palo OLAP Server, Apache Kylin, Oracle OLAP, icCube, Pentaho BI, JsHypercube, etc.
Conclusion
OLAP (Online Analytical Processing) is powerful technology behind many Business Intelligence (BI) applications that discovers data, report viewing capabilities, complex analytical calculations, and predictive scenario, budget planning, and forecast planning. It works as it first collects the data from multiple data sources (like a spreadsheet, video, XML, etc.) and is stored in data warehouses, which are then cleansed and organized into data cubes on which can run the user’s queries. The five types of analytical operations against the multidimensional databases that can perform are Roll-up, Drill-down, Slice, Dice, and Pivot. There are three OLAP types: MOLAP, ROLAP, and HOLAP. Some of the analytic tools (OLAP) are IBM Cognos, Micro Strategy, Palo OLAP Server, Apache Kylin, Oracle OLAP, icCube, Pentaho BI, JsHypercube, etc.
Recommended Articles
This has been a guide to What is OLAP? Here we discussed the basic concepts, required skills, advantages, and disadvantages, respectively. You can also go through our other suggested articles to learn more –
