Updated July 19, 2023
What is the Weighted Average in Excel?
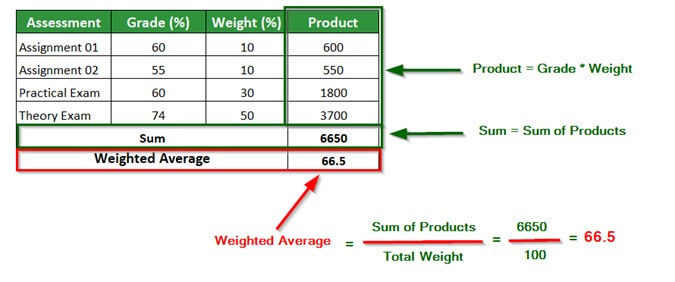
A weighted average in Excel uses SUMPRODUCT & SUM function to calculate the average of a set of values, where each value has a differing degree of importance (weight).
Weighted average and standard average calculations differ by the weights associated with each value. The standard average is for values with identical weights, and the weighted average is for values with different weights. In the following example, we have found the weighted average of a student’s marks using the SUMPRODUCT and SUM functions.
The weighted average in Excel is commonly used in the accounting field, in stock market evaluations, and in schools and universities for calculating the average marks of students.
Key Highlights
- The weighted average in Excel is calculated by taking the average of a set of values, each with different associated weights or values.
- Obtaining a weighted average involves determining the relative importance of each factor in a data set.
- A weighted average in Excel is usually more accurate than a standard (simple) average.
- Stock investors use weighted averages to track the cost basis of their bought shares at different times.
We use the SUMPRODUCT and SUM functions in Excel to find the weighted average of certain values.
SUM Function Syntax
number1, number2, number3: Indicate the numbers to be added in the data range
The SUM function adds the values of specified cells.
SUMPRODUCT Function Syntax
array1, array2, array3: Indicate the range that we want to add
SUMPRODUCT function provides the SUM (addition) of the products (multiplied) values in the selected date range
How to use the Weighted Average in Excel?
To understand the Weighted Average in Excel, consider the following examples.
Calculation Using SUM Function
Example #1
The below table shows the Brand Names of medicines with their prices per 1000 tablets, Quantity sold in a quarter, and the Sales value. We want to find the Weighted Average using the SUM function.
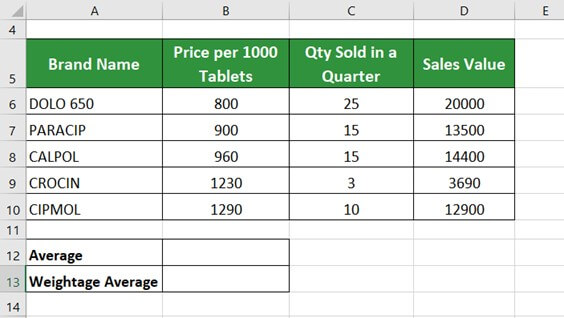
Solution: To understand the difference between the average and the weighted average in Excel, first, we will find the standard average of the Price Per 1000 Tablets.
Step 1: Place the cursor in cell B12 and enter the formula,
=AVERAGE(B6:B10)
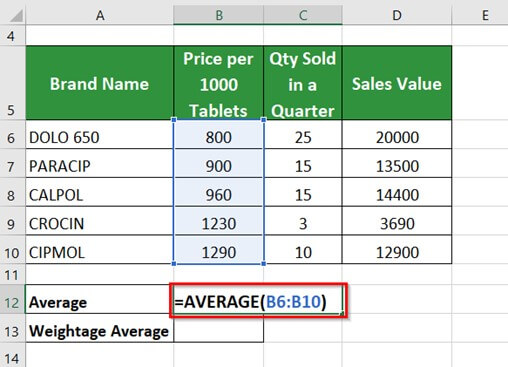
Step 2: Press the Enter key to get the below result
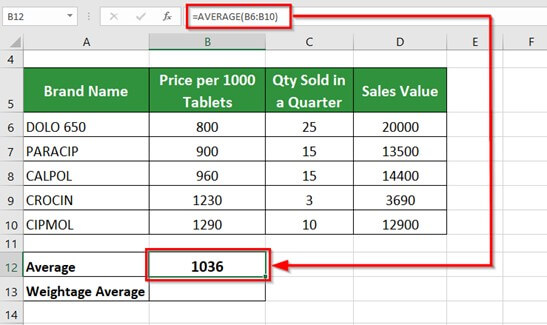
The AVERAGE formula calculates the average Price Per 1000 Tablets and gives the value of 1036.
Now, to calculate the weighted average in Excel,
Step 3: Place the cursor in cell B13 and enter the formula,
=SUM(B6*C6,B7*C7,B8*C8,B9*C9,B10*C10)/SUM(C6:C10)
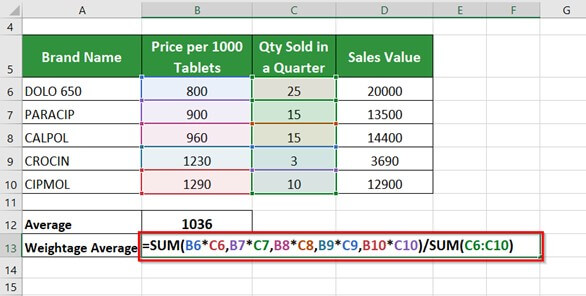
Explanation: To find the weighted average, we will first multiply all the values of the desired parameter (price per 1000 tablets) with their corresponding weights (quantity sold in a quarter), add them, and divide by the SUM of the weights (quantity sold in a quarter).
Step 4: Press Enter key to get the below result
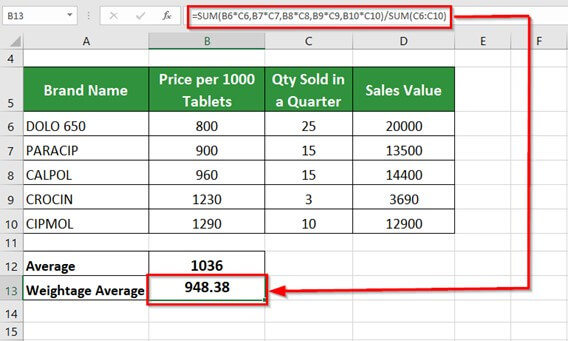
It gives a weighted average of 948.38.
Note: The SUM function is usually used to calculate the weighted average of small data tables. If we use it for large data sets, it may give erroneous results.
Calculation Using SUMPRODUCT and SUM Function
Combining SUMPRODUCT with the SUM function, gives accurate results without any error, and we can also use it to calculate the weighted average of large data sets.
Example #2
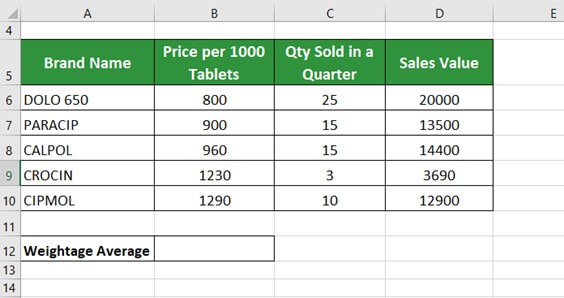
Consider the same data as above. Here, we want to find the weighted average using SUMPRODUCT and SUM Function.
Solution:
Step 1: Place the cursor in cell B12 and enter the formula,
=SUMPRODUCT(B6:B10,C6:C10)/SUM(C6:C10)
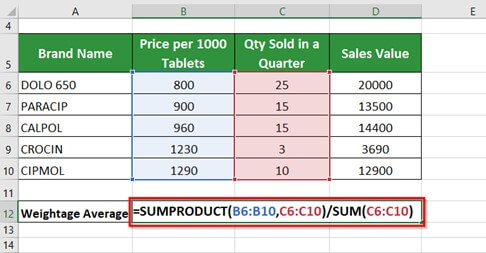
Explanation: The SUMPRODUCT function multiplies the dataset of two or more arrays and then adds the products. Therefore, here, it first multiples the price range per 1000 Tablets with the range of Qty Sold in a Quarter and then adds the product. This product is then divided by the SUM of Qty sold.
Step 2: Press Enter key to get the below result
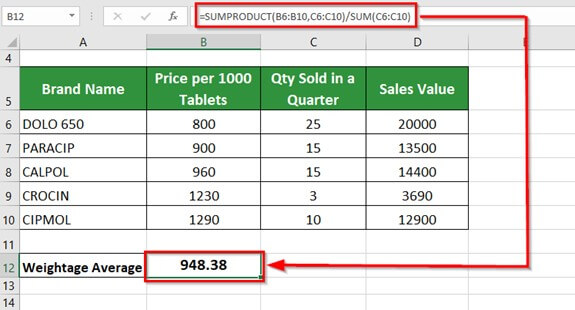
It gives a weighted average of 948.38.
Example #3
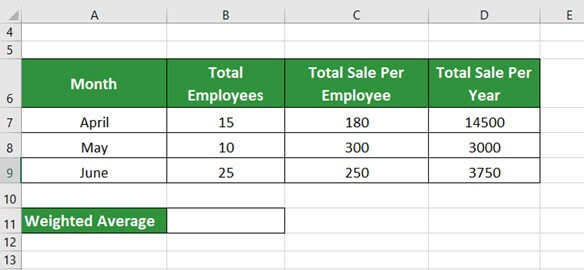
The table below shows the total number of employees with their total sales in April, May, and June and the total yearly sales. We want to calculate their weighted average using SUMPRODUCT and SUM functions.
Solution:
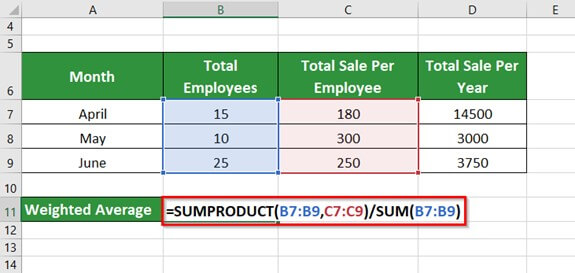
Step 1: Place the cursor in cell B11 and enter the formula,
=SUMPRODUCT(B7:B9,C7:C9)/SUM(B7:B9)
Step 2: Press Enter key to get the below result
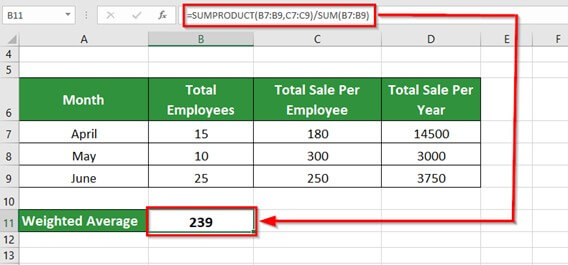
It gives a weighted Average of 239.
Example #4
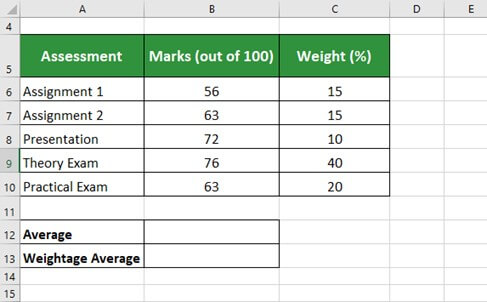
The table below shows a student’s marks in different assessment types- Assignment 1, Assignment 2, Presentation, Theory Exam, and Practical Exam. Each assessment has a different weight. We want to find the standard average and the weighted average of marks obtained by the student using the SUMPRODUCT and SUM functions.
Solution:
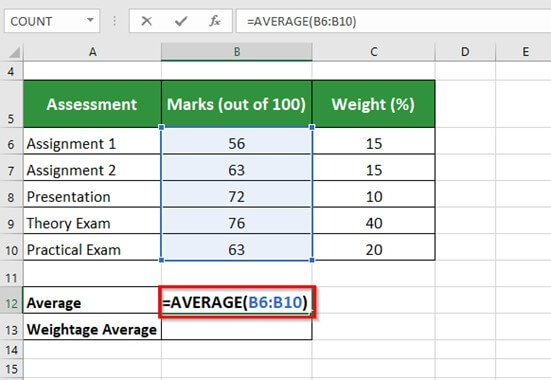
1] To find the Standard Average-
Step 1: Place the cursor in cell B12 and enter the formula,
=AVERAGE(B6:B10)
Step 2: Press Enter key to get the below result
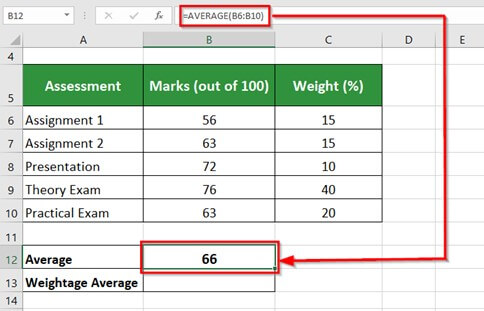
It gives the Standard Average of 66 of the marks obtained by the student.
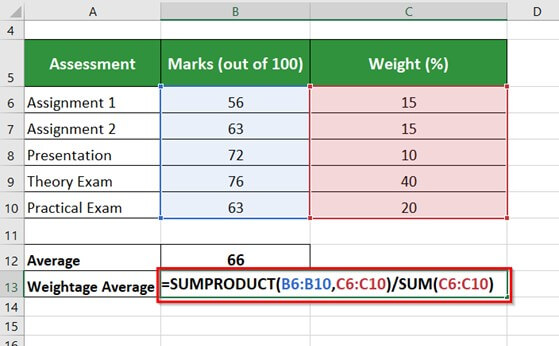
2] To find the Weighted Average-
Step 3: Place the cursor in cell B13 and enter the formula,
=SUMPRODUCT(B6:B10,C6:C10)/SUM(C6:C10)
Now,
Step 4: Press Enter key to get the below result
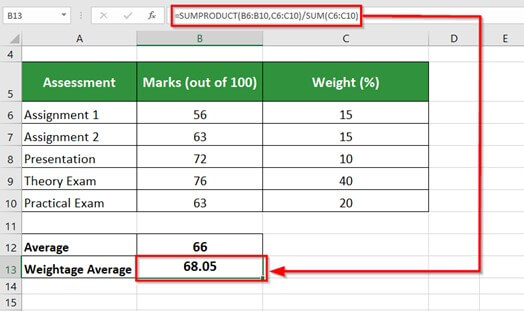
It gives a weighted average of 68.05.
Things to Remember
- SUMPRODUCT returns the #VALUE! Error if array arguments are of different sizes. Therefore, all array arguments must be the same size, or the same number of datasets should be present in each array.
- If the datasets contain text data in a range, SUMPRODUCT treats or considers them zero.
Frequently Asked Questions (FAQs)
Q1) What is the purpose of calculating a weighted average?
Answer: A weighted average is the average of certain values considering their respective weights. For example, a teacher calculates the weighted average of all the assessments in a semester, including theory exams, practical exams, and oral exams with different weights. It gives the average performance of the students in all the exams.
Q2) Why is weighted average better than simple average?
Answer: The weighted average in Excel considers the importance of relative factors within a data table. It is more accurate compared to the standard average calculation. For example, stock investors use a weighted average method to find the cost basis of their shares in the market.
Q3) What is the difference between weighted and unweighted averages?
Answer: One can better understand the difference between weighted and unweighted averages by using the GPA (Grade Point Average) marking system.. An unweighted GPA calculates the student’s overall average score (grade) out of 4.0, and a weighted GPA reflects grades and course levels.
Q4) What is the weighted average called?
Answer: The weighted average is also known as the weighted mean. In accounting calculations, both terms are interchangeably used. If the weights of all credits or values are equal, then the weighted mean will be the same as the arithmetic mean.
Recommended Articles
The above article has guided understanding and using Weighted Averages in Excel. EDUCBA would highly recommend reading the below-given articles for gaining more knowledge of Excel-related topics.
