Updated August 23, 2023
Excel Statistics (Table of Contents)
Introduction to Statistics in Excel
In this modern era where business solutions in a layman’s language are all people are thinking of, different dedicated software is developed and used for Statistical Analysis. It is a major part of the decision-making and finding out adequate solutions for your business problems. Despite the fact that it is not as powerful as the software designed dedicatedly for the Statistical Analysis, Excel still holds some of the power games to be able to do most of the Statistical Analytical tasks on its own and that too in a pretty simple manner. You need to be an advanced user of Excel, though, in order to be able to work on Statistical Analysis through Excel.
Examples of Statistics in Excel
We will see some examples using which we can calculate the statistics under Excel.
Example #1 – Find the Average
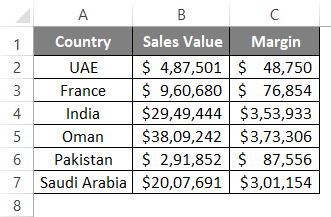
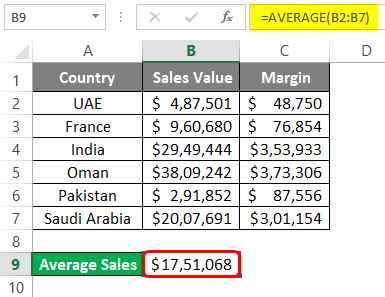
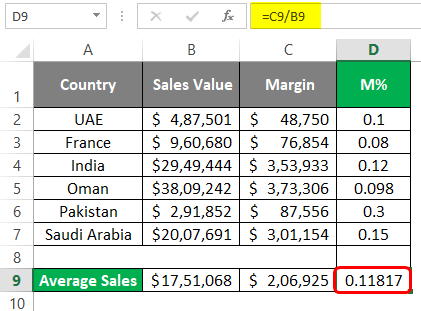
Suppose we have Country-wise Sales and Margin data as shown below:
We wanted to capture the average sales value for our company throughout these countries. The standard formula for Average is as below:
Average/Mean = Sum of All Values/ Number of Values
However, you have a built-in AVERAGE function in Excel that does this task for you.
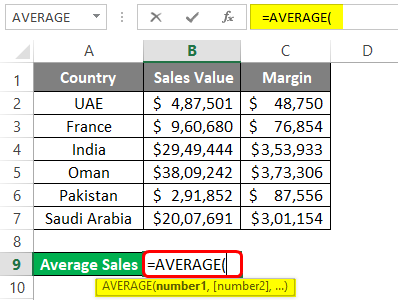
Step 1: In cell B9, start typing the formula =AVERAGE()
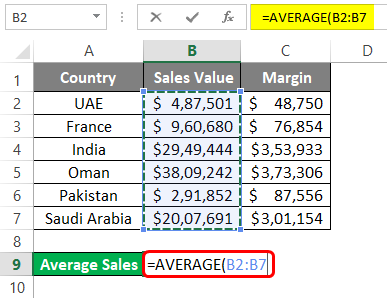
Step 2: Use B2:B7 (all sales values) as a reference under the AVERAGE function.
Step 3: Close the parentheses to complete the formula and press Enter key to see the output as shown below:
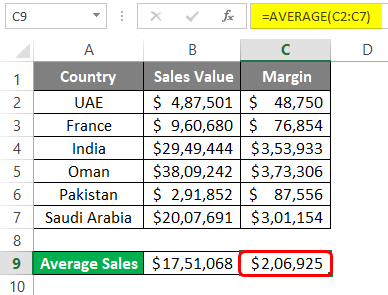
Step 4: Copy cell B9 and paste (Ctrl + V) it under cell C9 to get the average value for Margin. Well, this is one of the nicest Excel features of all time. You can copy the formulas and paste them into different cells to get the formulated results for the other column.
Example #2 – Margin Percentage for Each Country
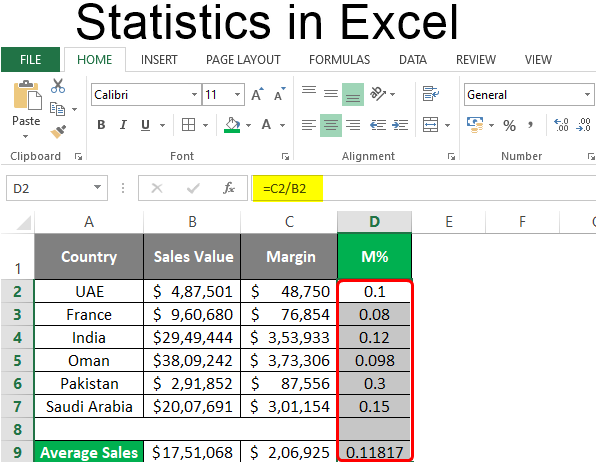
Suppose we wanted to capture the Margin % we have acquired through business with each country. Does percentage nicely show it all, you know? Let’s see how this can be done.
The general formula for calculating Margin% is as follows:
Margin% = Margin/Sales
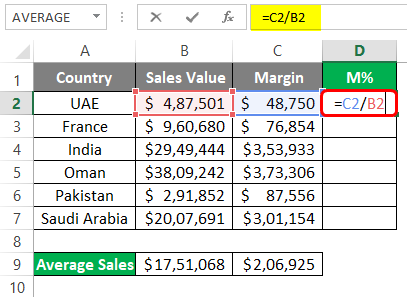
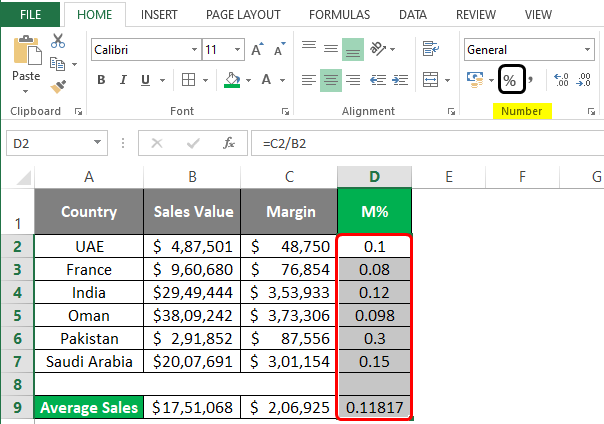
Step 1: In column D, under cell D2, use the formula as C2/B2 (Since C2 has Margin and B2 has Sales value for UAE).
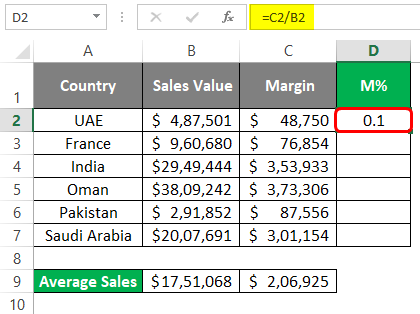
Step 2: Press Enter key to see the Margin% value we have acquired for UAE through our trade.
Step 3: Drag down this formula across the rows to see the Margin% we have acquired for different countries through trade. You can use the keyboard shortcut Ctrl + D to achieve the result. Select all the necessary sales, including D2, and press Ctrl + D.
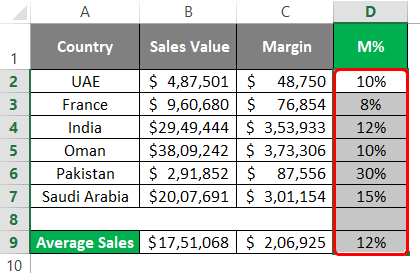
We need to change the number formatting for column D to be seen in a percentage format. Follow the step below to achieve the result.
Step 4: Select the entire column D. Go to the Home tab and navigate towards the Number group.
You can see the result below:
Example #3 – Find the Standard Deviation
We can also keenly understand how much the data points deviate from our data. We can find the Standard Deviation, which gives us a good idea about the spread of the data. It is very easy to calculate Standard Deviation under Excel. We have two functions to achieve the result.
STDEV.P and STDEV.S. STDEV.P works well when you have an entire population to cover, and STDEV.S is the one that can be used to figure out the Standard Deviation for a sample. Follow the steps below to be able to find the standard deviation.
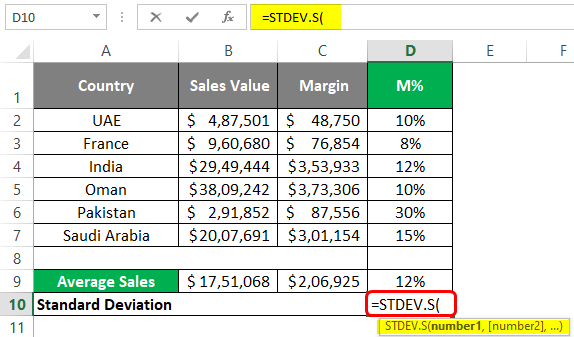
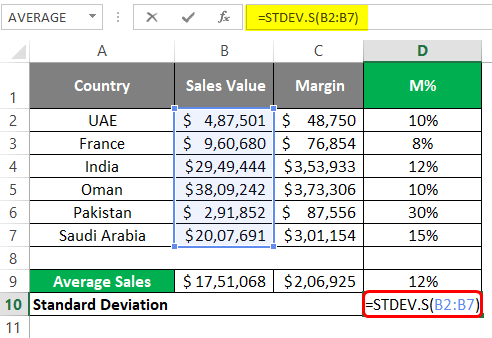
Step 1: Start typing the formula under cell D10 as =STDEV.S( to initiate the formula for sample standard deviation.
Step 2: Use the range of cells you wanted to capture the standard deviation. I will use the sales values spread across B2:B7 to reference the STDEV.S function. It will give me a single value representing the standard deviation between the Sales Values.
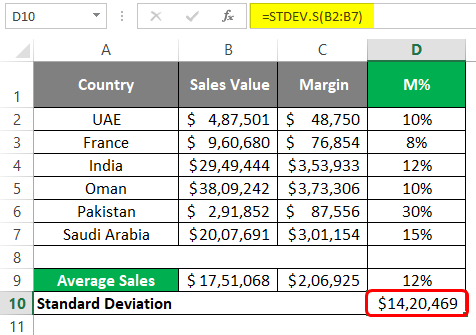
Step 3: Use closing parentheses to complete the formula and press Enter key. You’ll get a Standard Deviation value as shown in the screenshot below:
Example #4 – Regression Analysis
Regression Analysis is a widely used statistical technique to determine a relationship between two or more variables and predict the future (forecasting) based on the model fitted. It assumes that two variables have some kind of relationship (termed a correlation).
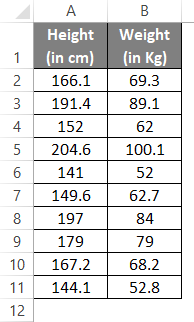
Suppose we have data of Height (in cm) and Weight (in kg) as shown below, and we are keen to know whether there is any relationship between both. If so, can we predict one based on the other?
This is a problem with Regression. Follow the steps below to run a regression analysis for the same.
Step 1: Navigate toward the Data tab and click on the Data Analysis button under the Analyze section.
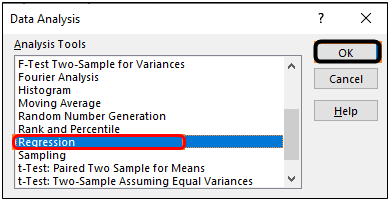
Step 2: The Data Analysis toolbox will pop up once you click there. Scroll down to navigate towards and select Regression. Click OK.
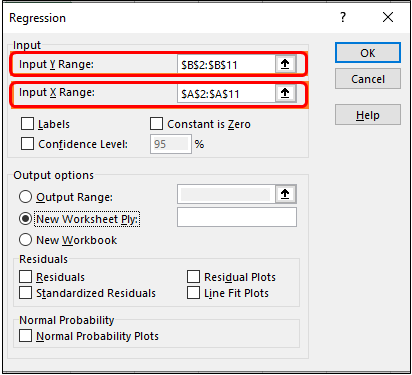
Step 3: Use B2:B11 as Input Y Range and A2:A11 as Input X Range under the Regression window that pops up.
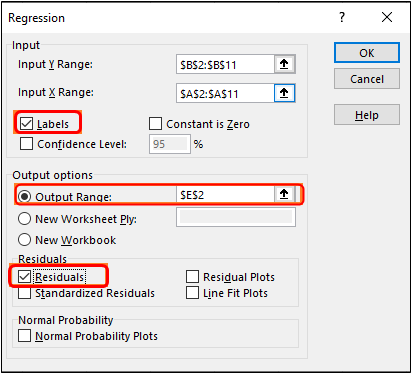
Step 4: Tick the Labels option, select Output Range as E2 of the current worksheet, and tick on Residuals to show the residuals for the data.
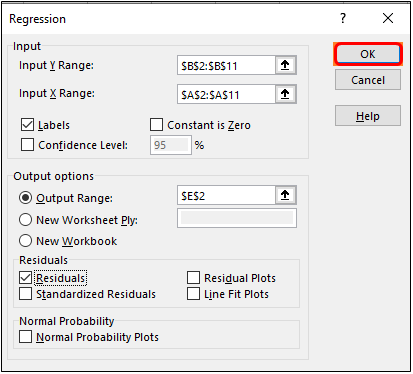
Step 5: Click the OK button once you are satisfied with your chosen output options. It is customizable; feel free to add some more residuals if you want.
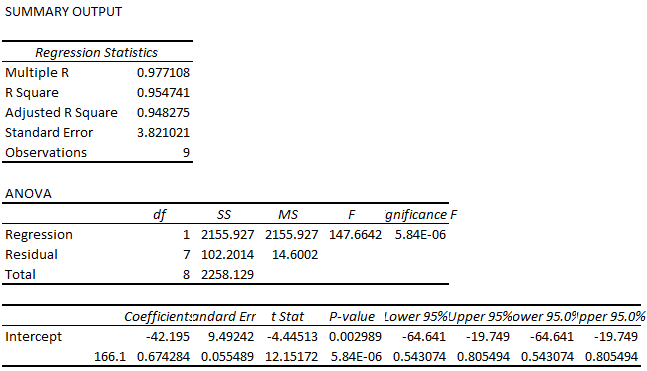
You can see a regression output in the image below under the same worksheet where data is present.
This is how we can use the statistical techniques in Excel to extract more analytical insights through our data. This article ends here.
Things to Remember
- There are more Statistical functions than the ones we have used in this article. Most formulae could be found under More Functions > Statistical functions encapsulated under Formulas sections.
- All basic Descriptive Statistics can also be calculated at once using Data Analysis Descriptive Statistics tool. This will capture Mean, Mode, Median, Range, Quartiles, Quartile Deviations, etc., for you at a single click.
- Working with advanced statistical techniques such as Regression, ANOVA, T-Test, F-Test, etc., is very easy within Excel. I mean, come on! All you need to do is select an appropriate technique and do some clicking.’
Recommended Articles
This has been a guide to Statistics in Excel. Here we discuss How to use Statistics in Excel, practical examples, and a downloadable Excel template. You can also go through our other suggested articles –

